
AdvancedMD Reporting and Power BI Analytics
Get more intelligence out of the AdvancedMD you already run.
AdvancedMD reporting comes in three levels. Report Center comes with AdvancedMD's billing and scheduling software, and AdvancedMD's website lists more than 150 standard reports plus nearly 500 financial reports. The Reporting and Analytics add-on adds dashboards and custom report building. Power BI sits on top, joining AdvancedMD data with payroll, accounting, and the bank to show why a number moved.
AdvancedMD's website lists about 650 reports. We answer the questions that are still open after all of them, by combining that data with data from the other systems in your practice, like payroll, accounting, and the clearinghouse (the service that carries your claims to the insurers).
AdvancedMD gives you ODBC and an open API for exactly this reason. It was built to let your data go further than the standard reports. We're the ally that takes it there, with Power BI on top of your AdvancedMD data.
Your reports tell you what happened. You need to know why, and what to do next.
If you run the practice, you know the feeling. You have pulled the same handful of reports every month for a year. The practice is doing well, and you can tell it could do better, but nothing on the screen says where. Every question turns into three more reports and an afternoon in Excel, and the answer still comes back as a guess.
If you own or invest in a group of practices, it's the same frustration at a bigger size. Each location runs its reports its own way, the monthly pack arrives late and disagrees with itself, and the board wants to know what moves the next point of margin. Getting to the next level takes one honest view of the money across every location, while it still matters.
You came looking for better AdvancedMD reporting, and you're in the right place. We build Power BI reporting on your AdvancedMD data, and the catalog further down covers nearly every report a practice could ask for. But a report is where this starts, not where it ends.
Your standard reports describe. They show you the balance, the total, the rate. What they can't do is tell you why the number moved, which part of the practice is driving it, or what to do about it. A report sees one system. Your practice runs across more than one: AdvancedMD, the clearinghouse, the payment processor, the scheduler. The answer usually lives in the gaps between them, where no single report can see.
Anyone can build a report. Knowing what to do with it's the rest of the job.
Most people who build reports have never been on the hook to run a practice. They can hand you a number. They can't tell you what it means or what to do about it, because they have never had to make payroll on it, fix a margin with it, or live with the outcome it points to. They have plenty of data. What they lack is the mindset.
We have run the practice, so we know what the number is supposed to be, because we have carried it, and we know how the same problem was solved in other industries that timed and fixed this kind of thing decades before healthcare looked at it. That's the difference between a chart and a decision. One shows you what happened. The other comes from someone who knows what should happen next and has done it before.
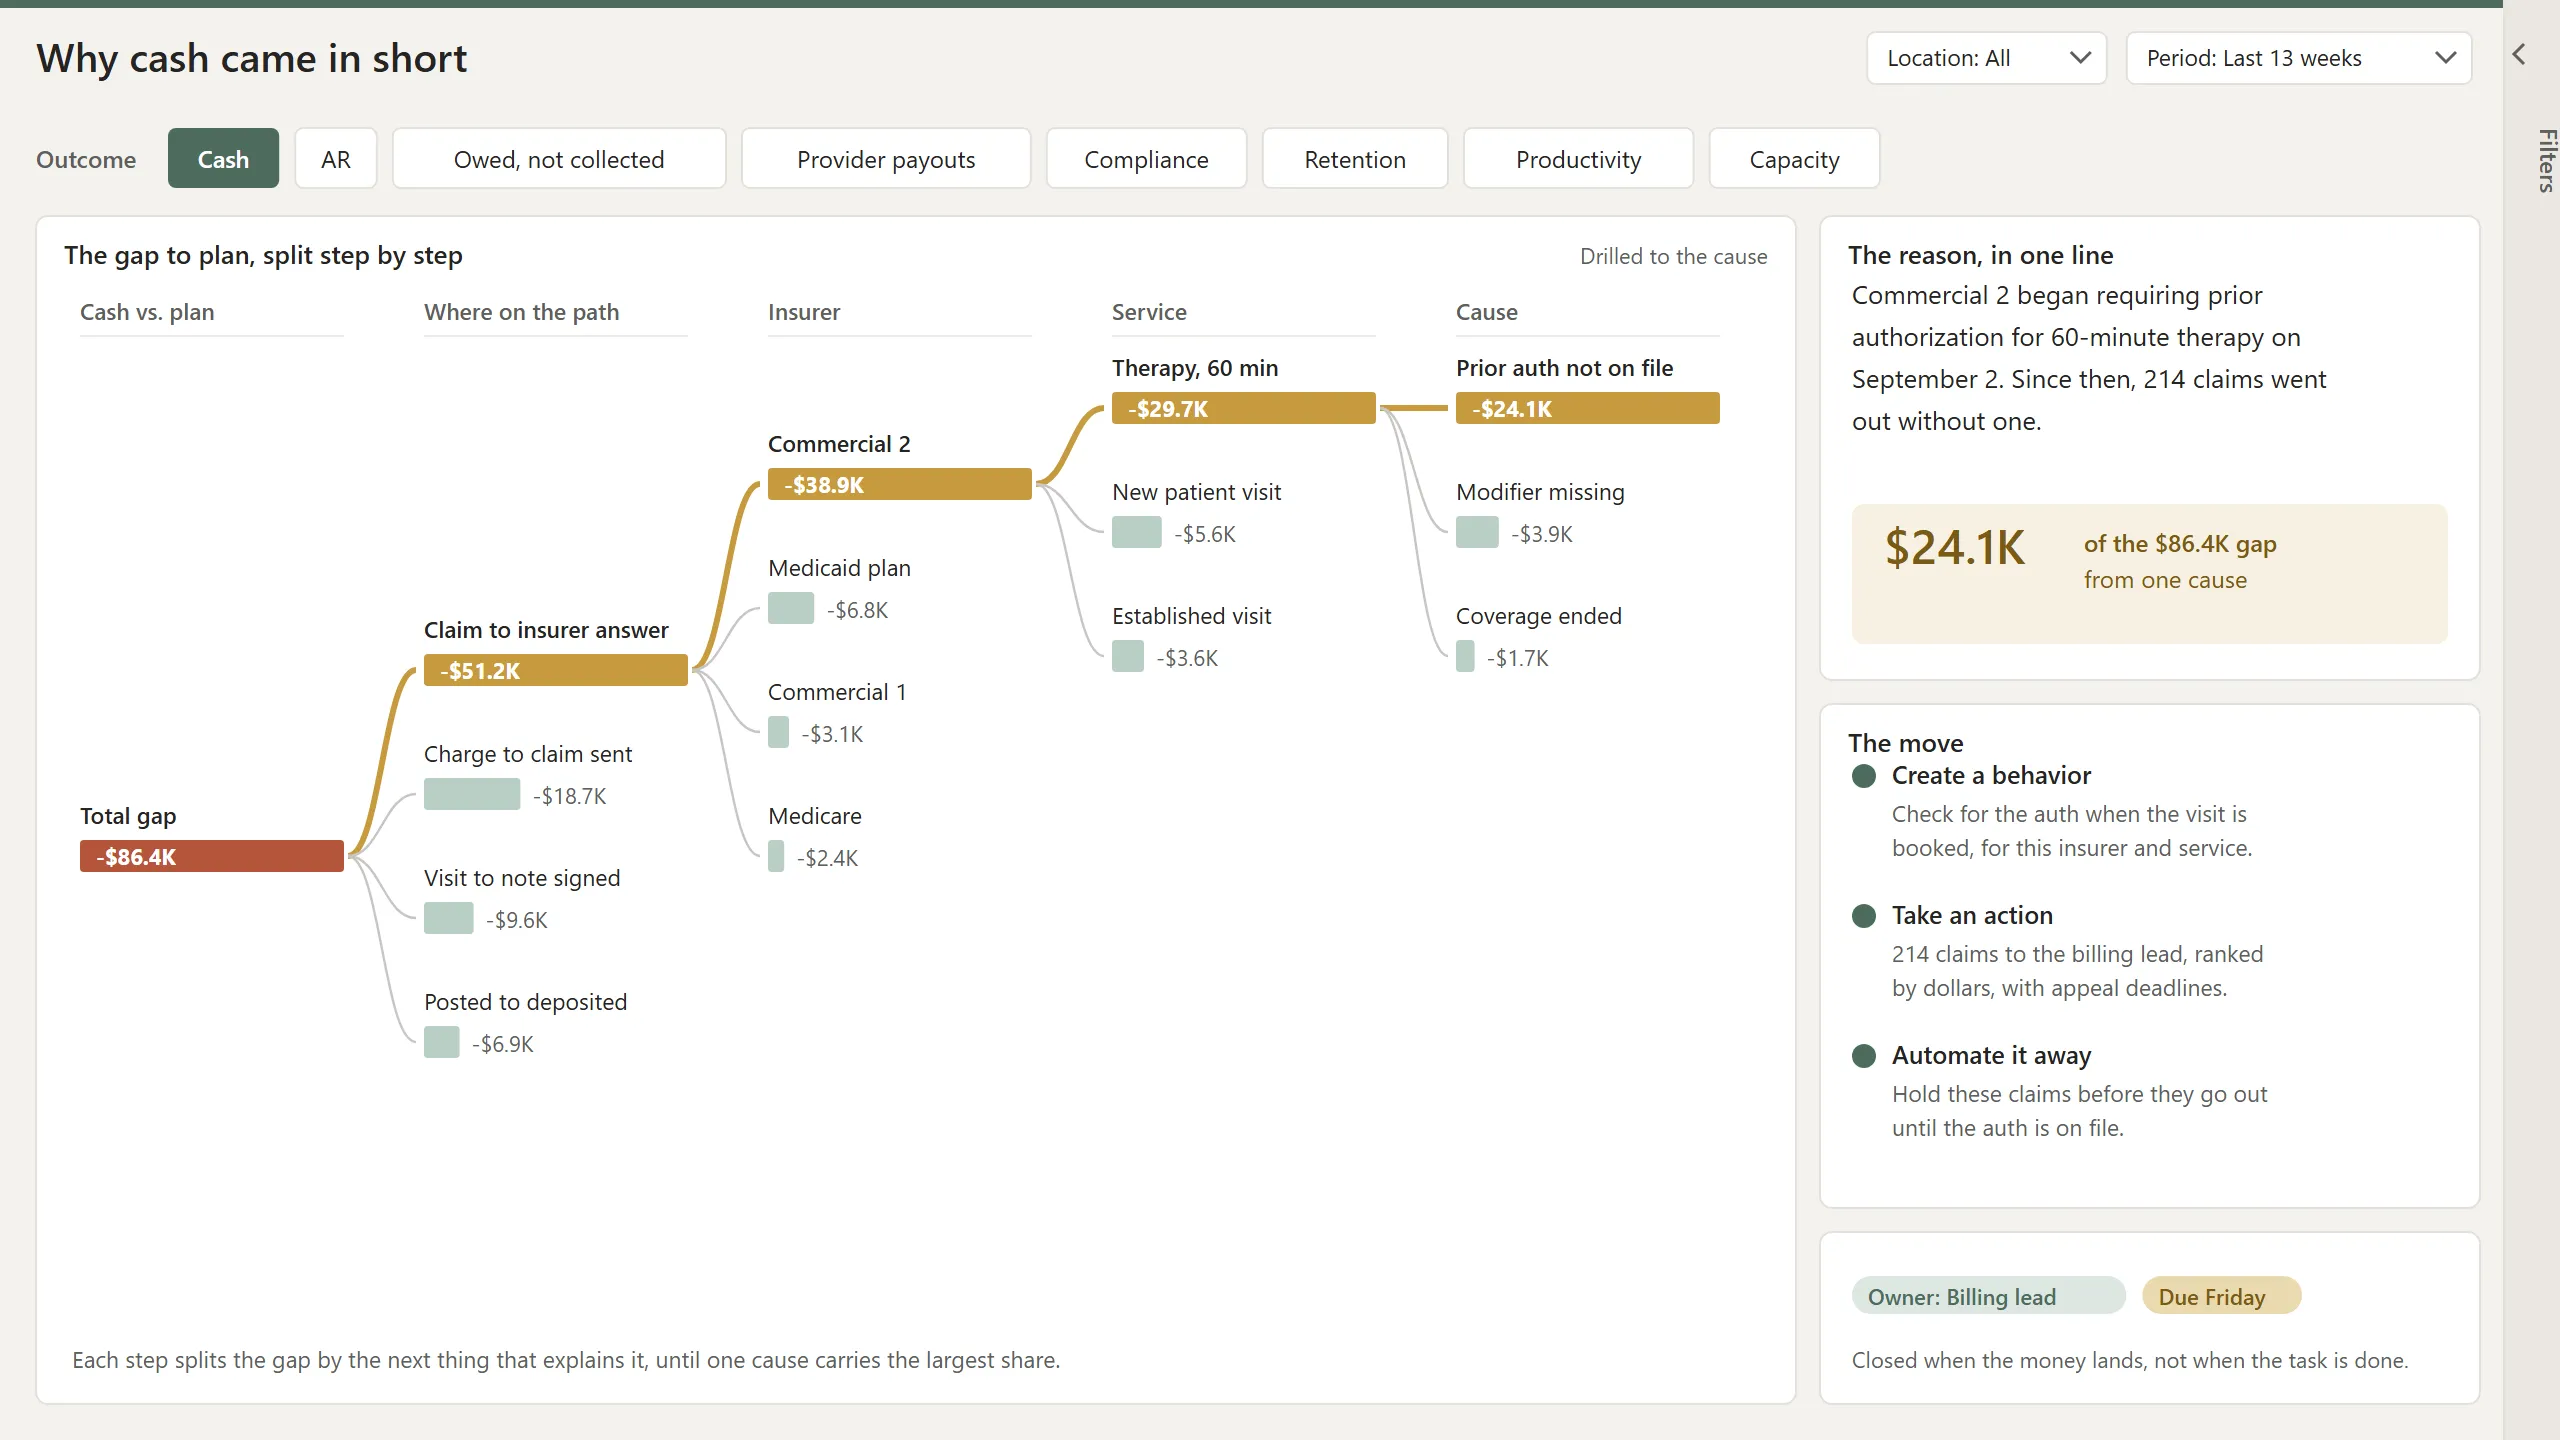
So here's how it works. We connect your AdvancedMD data with the systems around it, then work backward from the outcome you care about to the specific thing in the data that's driving it. Not a chart of what happened. The reason it happened, traced to the exact stage, insurer, provider, or behavior responsible.
And it points at whatever your practice runs on. Cash. AR. The insurance revenue you're owed but not collecting. Provider payouts. Then compliance, retention, productivity, capacity, and every other outcome you measure. The method is the same. The outcome it's aimed at is yours to choose.
AdvancedMD reporting, level by level.
AdvancedMD's website lists about 650 reports. A paid add-on sits on top that trends and compares them. Between the two, most questions a practice asks get answered. The rest are all the same kind: the answer needs two pieces of information put side by side, and one of them usually lives in another system such as payroll, accounting, or wherever your new patients come from. AdvancedMD gives large practices the tools to do that. PracticePath does the work: whether a clean claim rate (the share of claims paid the first time they're sent) is real, how much capacity got used, where money leaked and at which step, and what to fix first.
You ran the report. Then you ran three more. The number you came in for is still not on the screen, and by now you're half wondering whether it exists at all. It does. Part of it's in AdvancedMD. Part of it's in a system sitting right next to AdvancedMD. Nothing puts the two halves together, because putting them together was never a report's job.
Level one. Report Center.
Included with the billing software. AdvancedMD's website lists about 650 reports, covering collections, aging, denials, provider production, insurer mix, no-shows, coding, and patient balances. Set your own date ranges and filters, save favorites, pull up the last twelve you ran. AdvancedMD's website also lists a dashboard you arrange by drag and drop, recommended reports with a short description of each, a search bar that suggests reports as you type, and Excel export. Odds are you have opened a fraction of it.
Level two. Reporting and Analytics.
A paid add-on. It carried the name AdvancedInsight until AdvancedMD gave it a refresh. This is the trending tier. It compares months, tracks how insurer payments are moving, flags providers running outside the pattern, and exports to Excel. AdvancedMD's February 2022 release notes describe the refresh. It added report building, dashboard setup, and a Data Table report you can drill into and expand. It also added a Filter Finder for searching data fields, a toolbar you can pin to the top of a report, PDF export of dashboards, and My Pin, which copies a dashboard with its filters and colors.
Level three. The tools for large practices.
Listed under Enterprise and Group Practices rather than under reporting, which is why most owners never come across them. They let a practice read its own data outside the report screen, keep a copy of it, and hook other systems to it.
Level three has been there for years. Very few practices use it. Not because it costs too much and not because they lack permission. What comes out is raw data, and raw data needs someone who reads it for a living. We work level three, with Power BI on top, so the answer can pull in your other systems too.
If your questions are about trends and comparisons, the add-on is the cheaper answer and it does that job well. Start there.
If the questions you keep coming back to are the ones marked PracticePath below, the add-on is answering a different class of question, and you would be paying for a job you didn't need done. Some practices run both, and some go straight to level three. Either is a reasonable call, and it's worth ten minutes before the invoice rather than a year after it.
101 AdvancedMD reporting questions, and where each one lands.
These are examples, not a menu. They're the questions we hear the most, grouped by the smallest thing that answers them. Each level covers the one before it, so a Report Center question is answered by all three and the last group is answered in one place. Anything AdvancedMD already covers, we will point you at before you spend a dollar with us.
+Click or tap any group below to open its examples.
Money
Report Center 13
All three answer these- What does my aging look like today
- Which insurers are holding the most of my money
- What's my denial rate
- What's my clean claim rate
- What's my insurer mix
- What did patients pay us last month
- What have we collected year to date
- What did we charge in total
- What did we collect in copays, coinsurance and deductibles
- What do patients still owe us
- What did we write off
- What's the average charge per visit
- What posted to the ledger yesterday
Reporting and Analytics 7
The add-on and PracticePath answer these- How has aging moved over six months
- Are insurer payments trending up or down
- What are we collecting per unit of provider work
- Which of my top insurers changed behavior
- How does this month compare to the same month last year
- Is my collection ratio improving or slipping
- How do my aging days compare across quarters
PracticePath 19
Answered in one place- How many days from the visit to money in the bank
- Where in those days is the money actually sitting
- How much work is done right now that can't be billed yet
- How many denials started as a mistake at check-in
- What does a denial really cost once rework hours are counted
- Which insurer disputes are buried under a heading nobody reads
- Is a drop in my numbers my billing or the insurer changing
- Is my clean claim rate telling me the truth
- Which denials keep coming back and what's causing them
- Which of these problems can be made to stop on their own
- Why is one month strong and the next one weak
- What should we fix first, and what's it worth
- How does what we billed compare to our budget
- What will cash look like ninety days out
- What does each location earn after shared costs are split fairly
- What does each service line earn after true cost
- What are we leaving at the front desk before the patient walks out
- Whose card on file is about to expire
- What's our revenue after operating costs, honestly counted
Staffing and process
Report Center 8
All three answer these- What are my no-show and cancellation rates
- What did each provider produce last month
- How many encounters did each provider have
- What did the clearinghouse send back
- Which charge slips are missing
- How many appointments were scheduled versus kept
- How many same-day appointments did we run
- Who are my patients, by age and area
Reporting and Analytics 4
The add-on and PracticePath answer these- Which providers are running outside the pattern
- Is provider productivity trending up or down
- Are we hitting our scheduling targets
- How does this quarter compare to last
PracticePath 16
Answered in one place- How long does work sit between the people who touch it
- How many staff do we need for the volume we run
- How does our staff-to-patient ratio affect what we collect
- What did staff turnover cost us in collections
- Which check-in mistakes are causing next month's denials
- Where does the same claim get touched more than once
- Which steps in our process create the rework
- How much of our open schedule turned into money
- How much more could we see without hiring anyone
- How much of the capacity we pay for did we actually use
- How many visits will we do next quarter
- What does it cost us to deliver each type of visit
- What's a referral source worth a year later
- Which marketing spend actually produced a patient who stayed
- How long does a new patient wait for their first appointment
- What happens to revenue when a provider goes on leave
Care
Report Center 5
All three answer these- Which notes are unsigned or not yet billed
- Which procedure codes are we using
- Which diagnosis codes are we using
- How many visits has each patient had
- What was prescribed, and by whom
Reporting and Analytics 2
The add-on and PracticePath answer these- Whose coding has shifted this quarter
- How does each provider's coding compare to the group
PracticePath 10
Answered in one place- How long from the visit to a signed note, by provider
- How much revenue is stuck behind unsigned notes right now
- Are patients coming as often as their care plan says
- Which recall lists actually bring people back
- Which chronic care patients are overdue and what's that worth
- Which documentation gaps turn into denials later
- Which care gaps carry a dollar figure
- Do outcomes differ by provider once case mix is accounted for
- Which visit types are we under-coding
- Where does the plan of care and the schedule disagree
Patients
Report Center 5
All three answer these- What's each patient's balance
- What did each patient pay and when
- What does a patient's visit history look like
- How many new patients did we see
- Who is using the patient portal
Reporting and Analytics 3
The add-on and PracticePath answer these- Are patient payments trending up or down
- Is new patient volume growing
- How does patient retention compare across locations
PracticePath 9
Answered in one place- Which patients stopped coming and what did that cost
- Which providers lose the most patients over three years
- How many patients never came back after their first visit
- Which patients are about to lapse
- What's a patient worth over the life of the relationship
- Why do patients leave, by pattern rather than by anecdote
- Does how we ask change whether a patient pays
- Which patients are one missed appointment from gone
- Does satisfaction predict whether they came back
Forty-seven are already answered inside AdvancedMD. We answer those too, and the other fifty-four as well.
Most reporting runs forward. We run it backward.
Here's the data, go find something interesting in it. That's how a practice ends up with a wall of dashboards and the same three questions still open.
Name the number you want to move. Work back to what actually drives it. Only then decide what needs looking at.
Say the number is how fast cash arrives. Cash arriving depends on how fast work becomes billable, how cleanly it goes out the door, and how much of it comes back. Those trace to notes getting signed, to what happened at check-in, and to how the patient was asked to pay. Those are the things we measure. Nothing else earns a place on the report.
The chain always ends in somebody's hands, and those hands belong to different people. So the same finding has to arrive in different shapes.
The number, where it's heading, what the gap is worth
Decides where money and attention go
Which step is slipping and by how much
Moves people, changes the process
Their own short list, today
Signs the notes, closes the charts
A worklist with names on it
Works it before it turns into aging
The same number with the workings attached
Asks harder questions and gets answers
One truth underneath, five ways of seeing it. A provider handed the owner's view does nothing with it. An owner handed the provider's list learns nothing from it.
We read a practice the way an operator reads one. The questions under every report we produce stay the same. How much cash does this practice actually throw off? How steady is that from one month to the next? How much of the capacity you already pay for turned into revenue? Everything above traces back to one of those three.
Real findings, across different outcomes
Each one points at a different outcome, because the intelligence isn't built for one kind of problem.
A retention number that looked healthy hid the truth underneath it. Broken out by provider, some kept nearly all their follow-ups and others lost a third. The blended average made a fixable, concentrated problem look like an unavoidable practice-wide one.
A collectible AR line carried six figures that had already been written off months earlier, reclassified into a category nobody had split open. The report showed the money as coming. It was gone.
A clean claim rate that read as a team problem was mostly a payer one. a mid-six-figure block of disputes sat blended into an "other" category, invisible as its own issue, while the billing team got blamed for a number they didn't control.
None of these showed up on a standard report. Each one took pulling the data apart and reading it forward, as a signal of what's happening now, instead of backward, as a record of what already went wrong.
Why the same question keeps coming back.
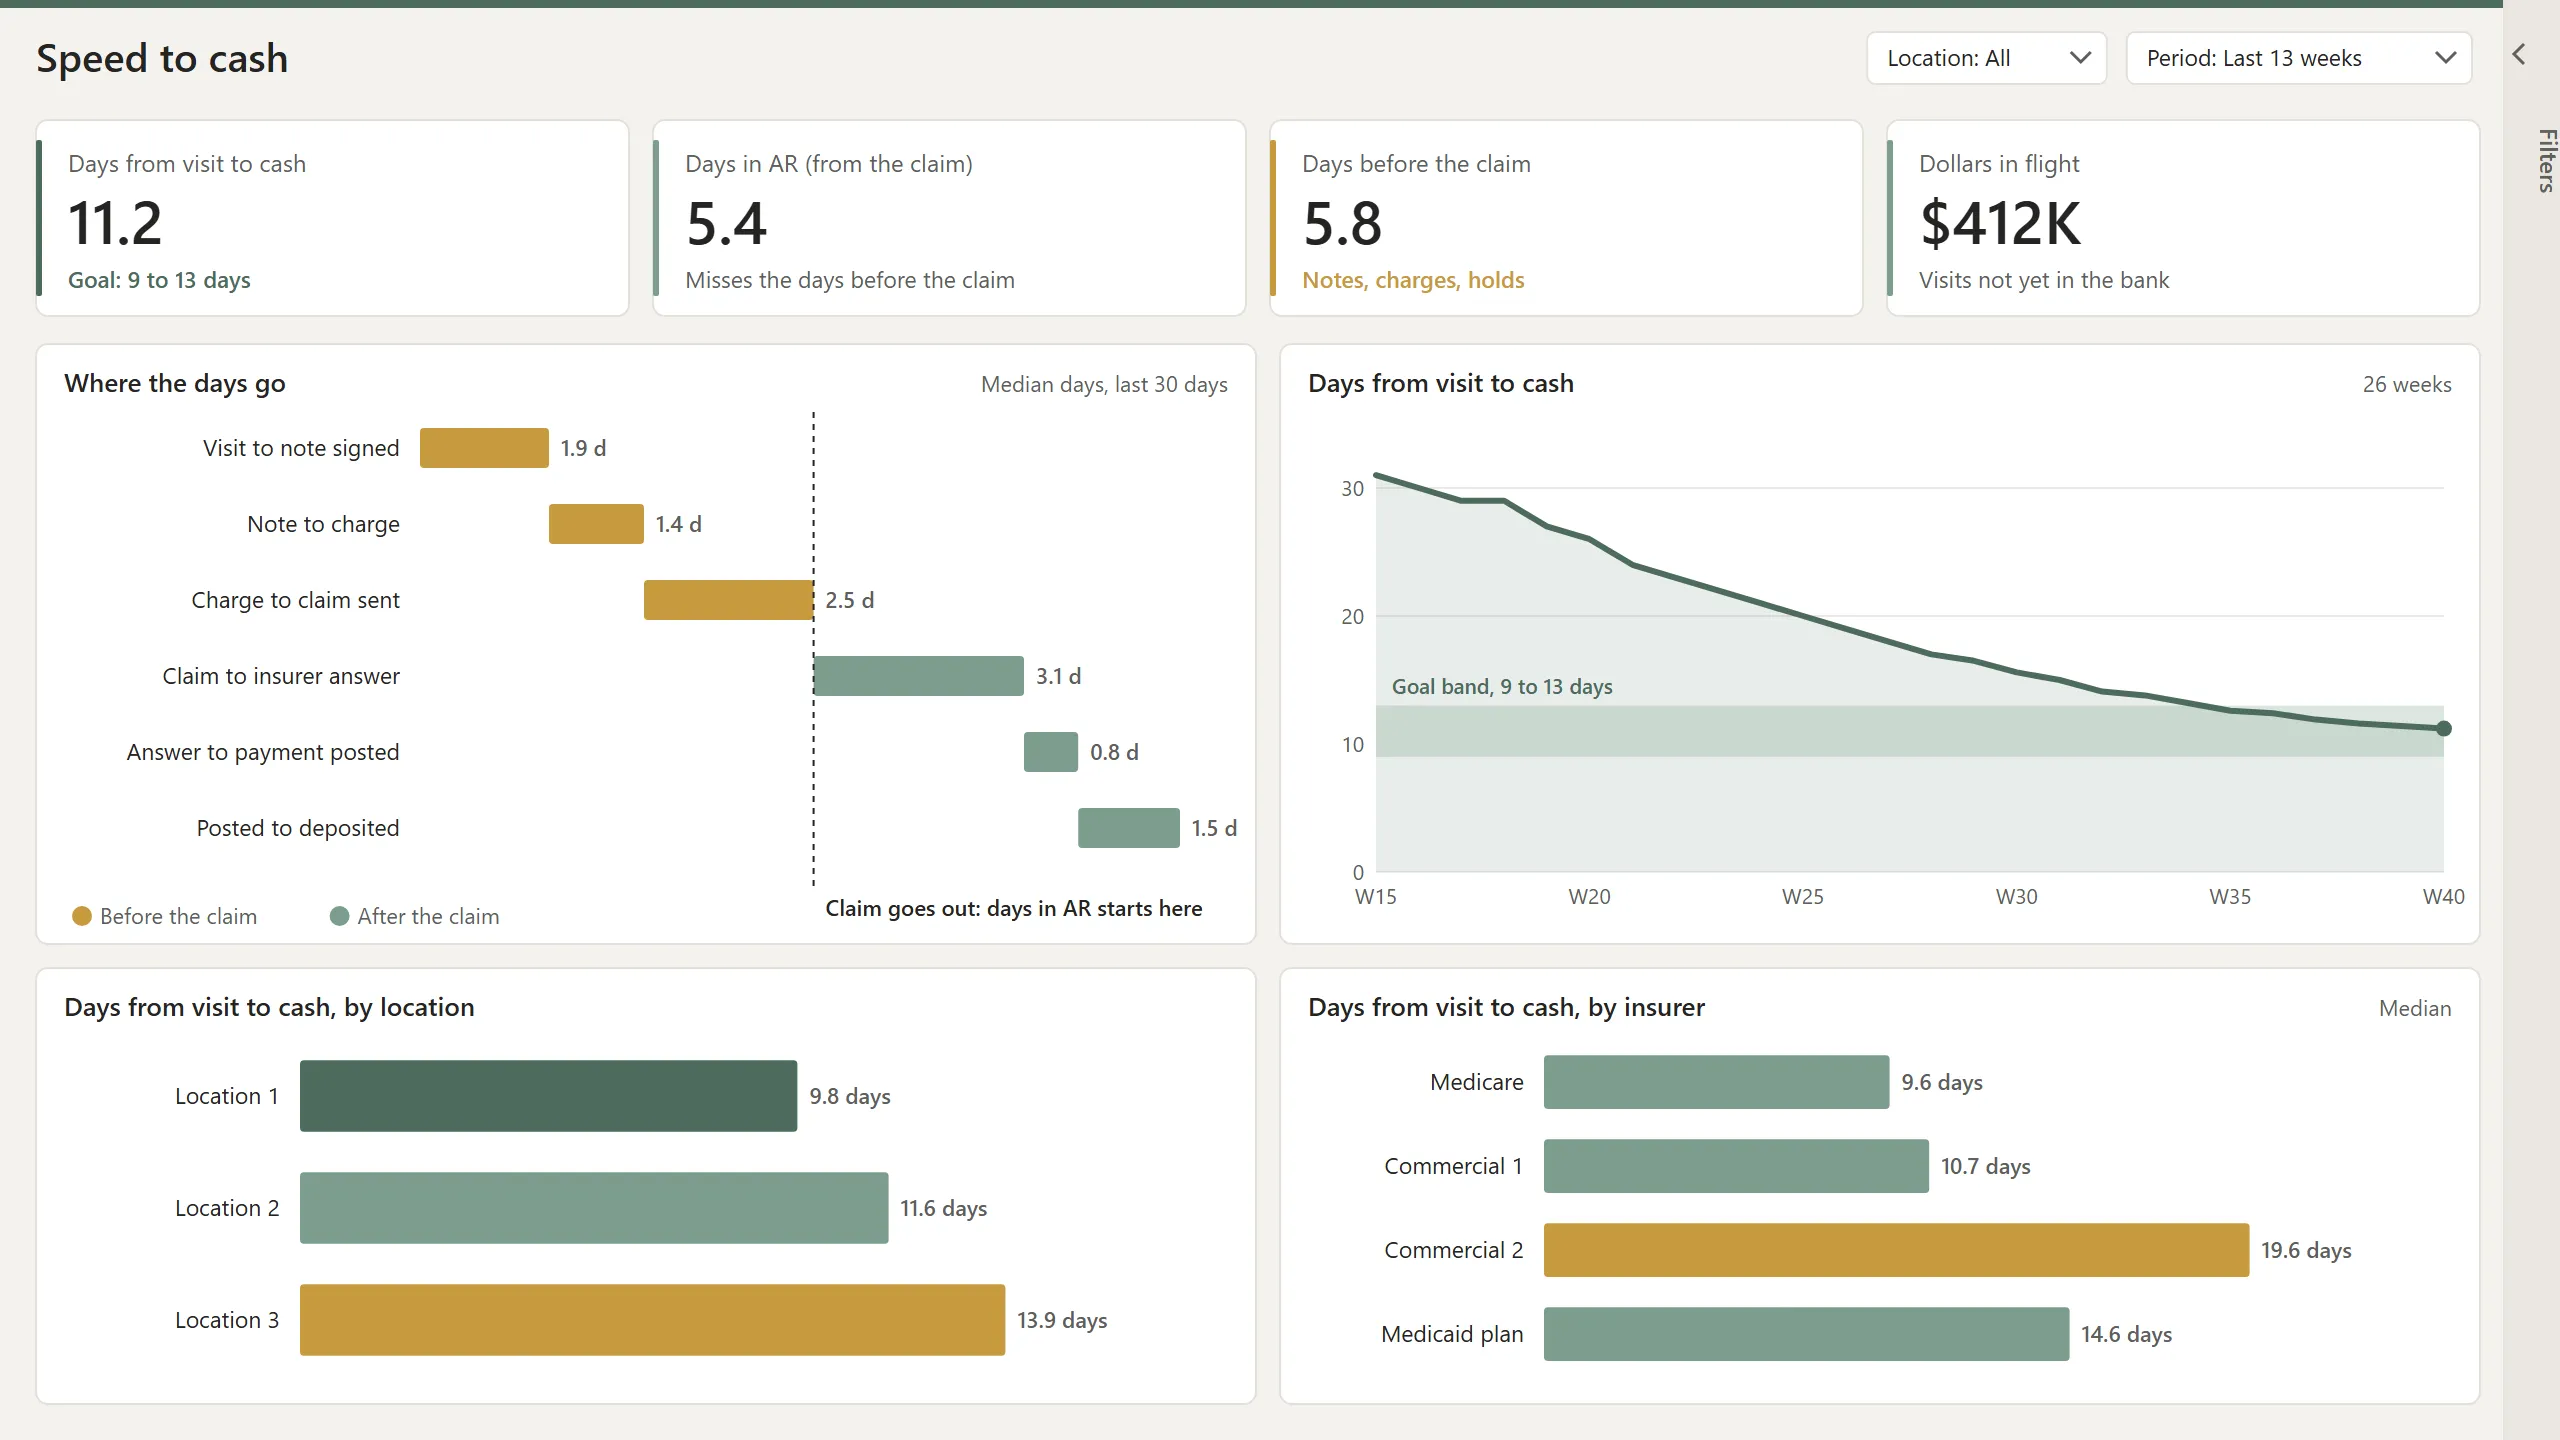
Take the one every owner asks. How long does it take us to get paid.
Days in A/R answers it. But days in A/R starts counting the day the claim goes out. The visit was earlier. In between sits a note nobody signed, a charge nobody coded, a claim waiting on a batch. None of that's inside the number, so a practice can work on days in A/R with real effort and watch nothing move.
At one practice we worked with, hundreds of charge slips sat unsigned on a single day. The work was done. The money was earned. None of it could be billed yet, and none of it showed up in A/R, because A/R hadn't started counting.
Start the clock at the visit instead of the claim and every one of those days becomes visible. Same information. Different clock.
Reporting shows the number. Oversight makes sure somebody moves it.
Revenue oversight is the daily job of watching every visit from the booked appointment to money in the bank. A visit can stop in twelve places on that trip, and at least half of them wait on someone inside your practice. A report can show you where money stopped. Oversight makes sure the right person hears about it the same morning.
Every night, every appointment gets walked from booked to paid. The places where money stopped, or is about to, become a short morning list ranked by dollars. Each line has an owner, a due date, and what done looks like. The list opens with what happened to yesterday's items, so nothing drops off without anyone noticing.
Done means verified. An item isn't closed when the task is finished. It's closed when the insurance company acknowledged the claim, the payment was recorded, and the money is in the bank. Power BI is where the numbers live. Oversight is the habit that keeps them moving.
Read more: who owns revenue oversight at your practice, and how revenue oversight works, rule by rule.
AdvancedMD Power BI reports, page by page.
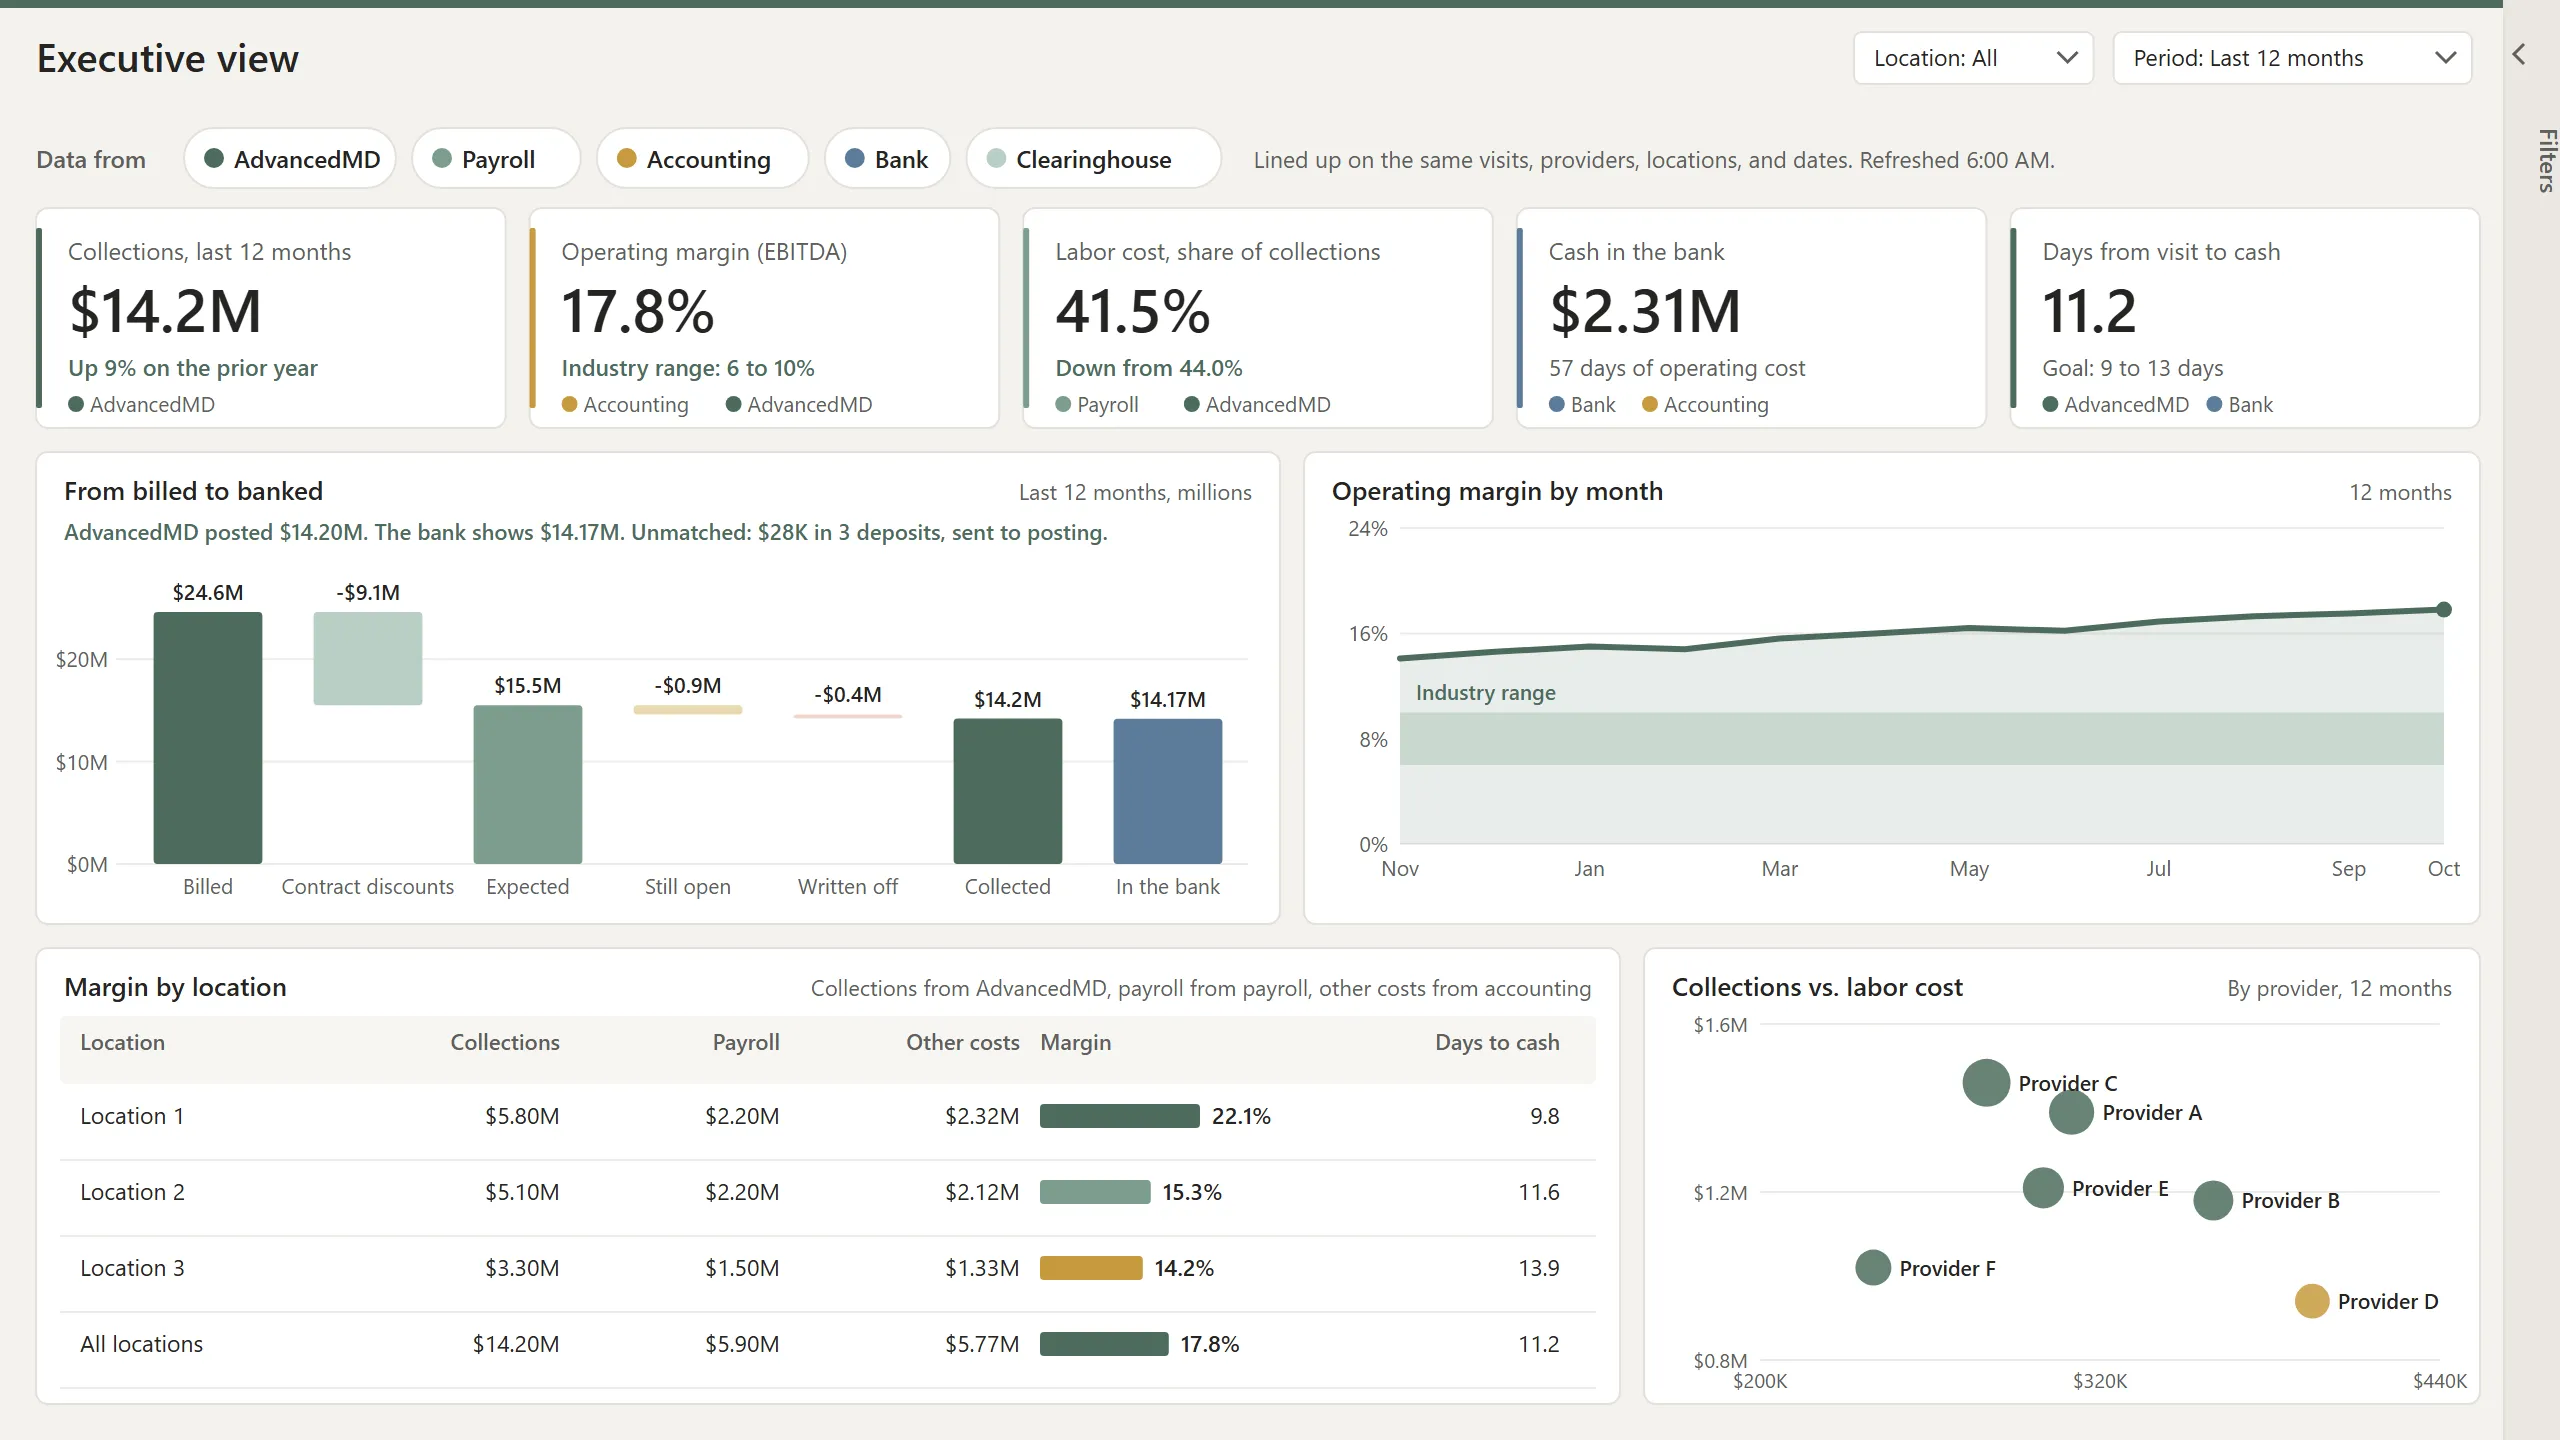
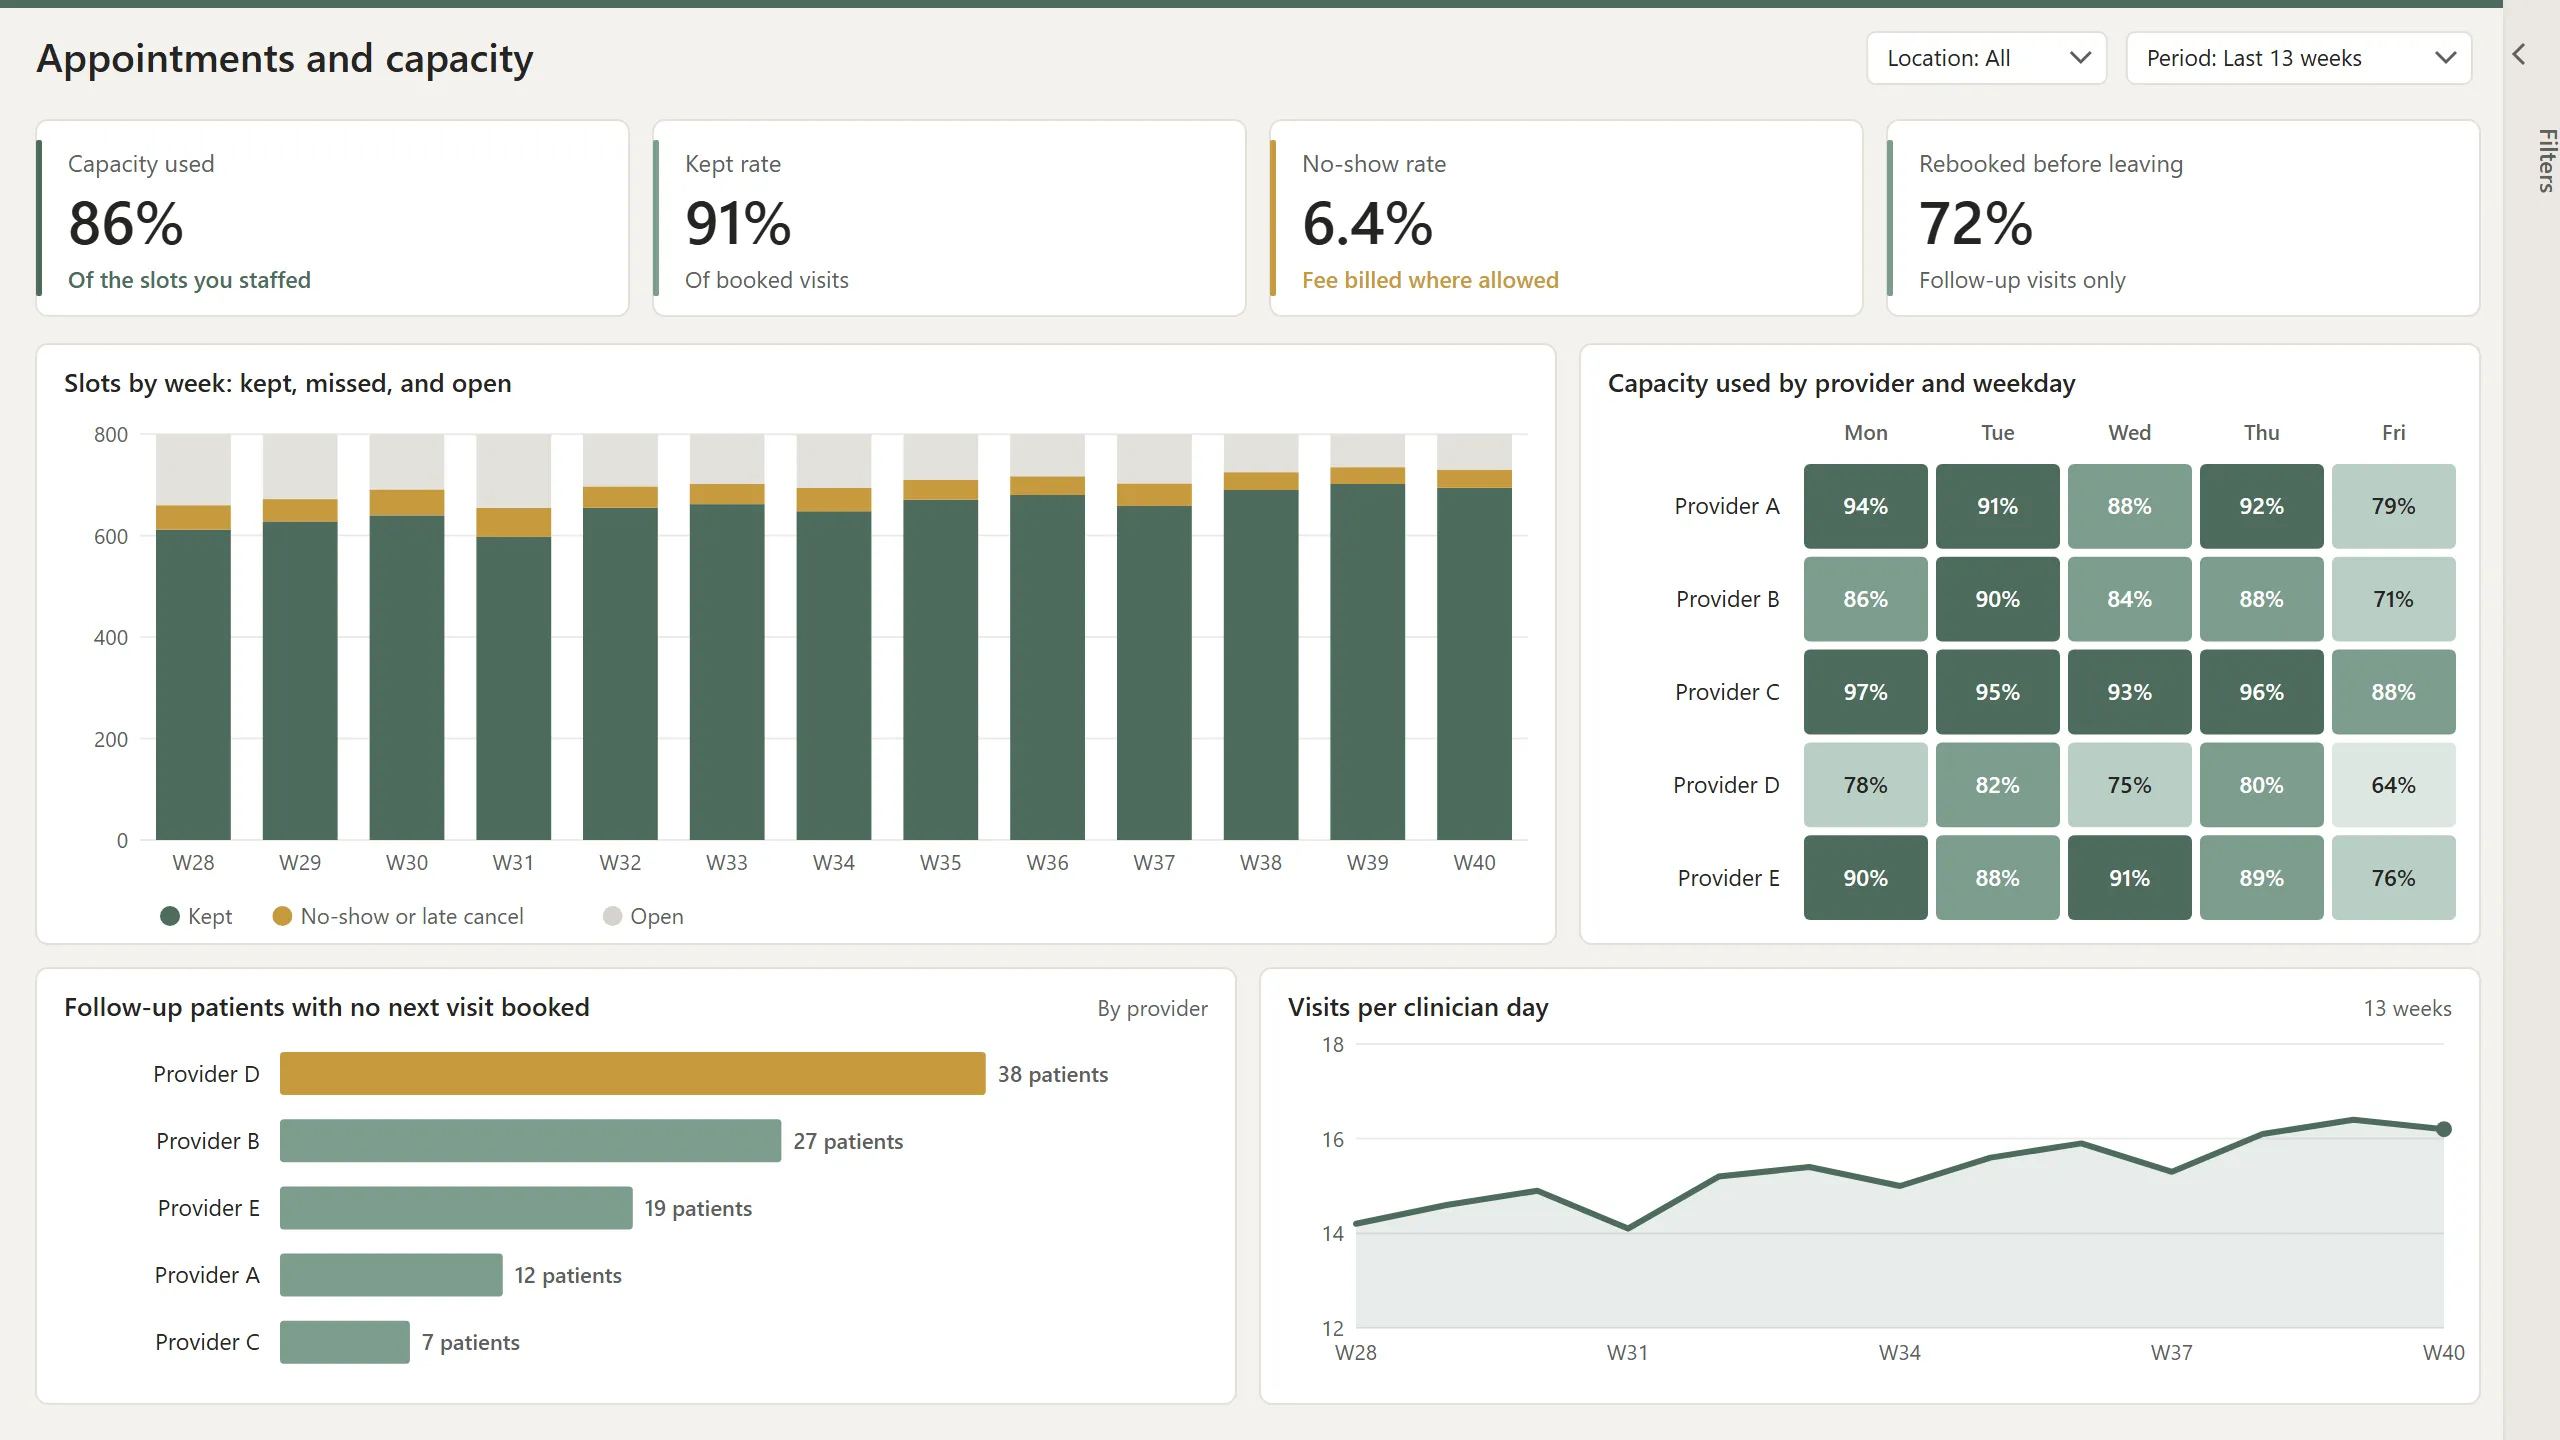
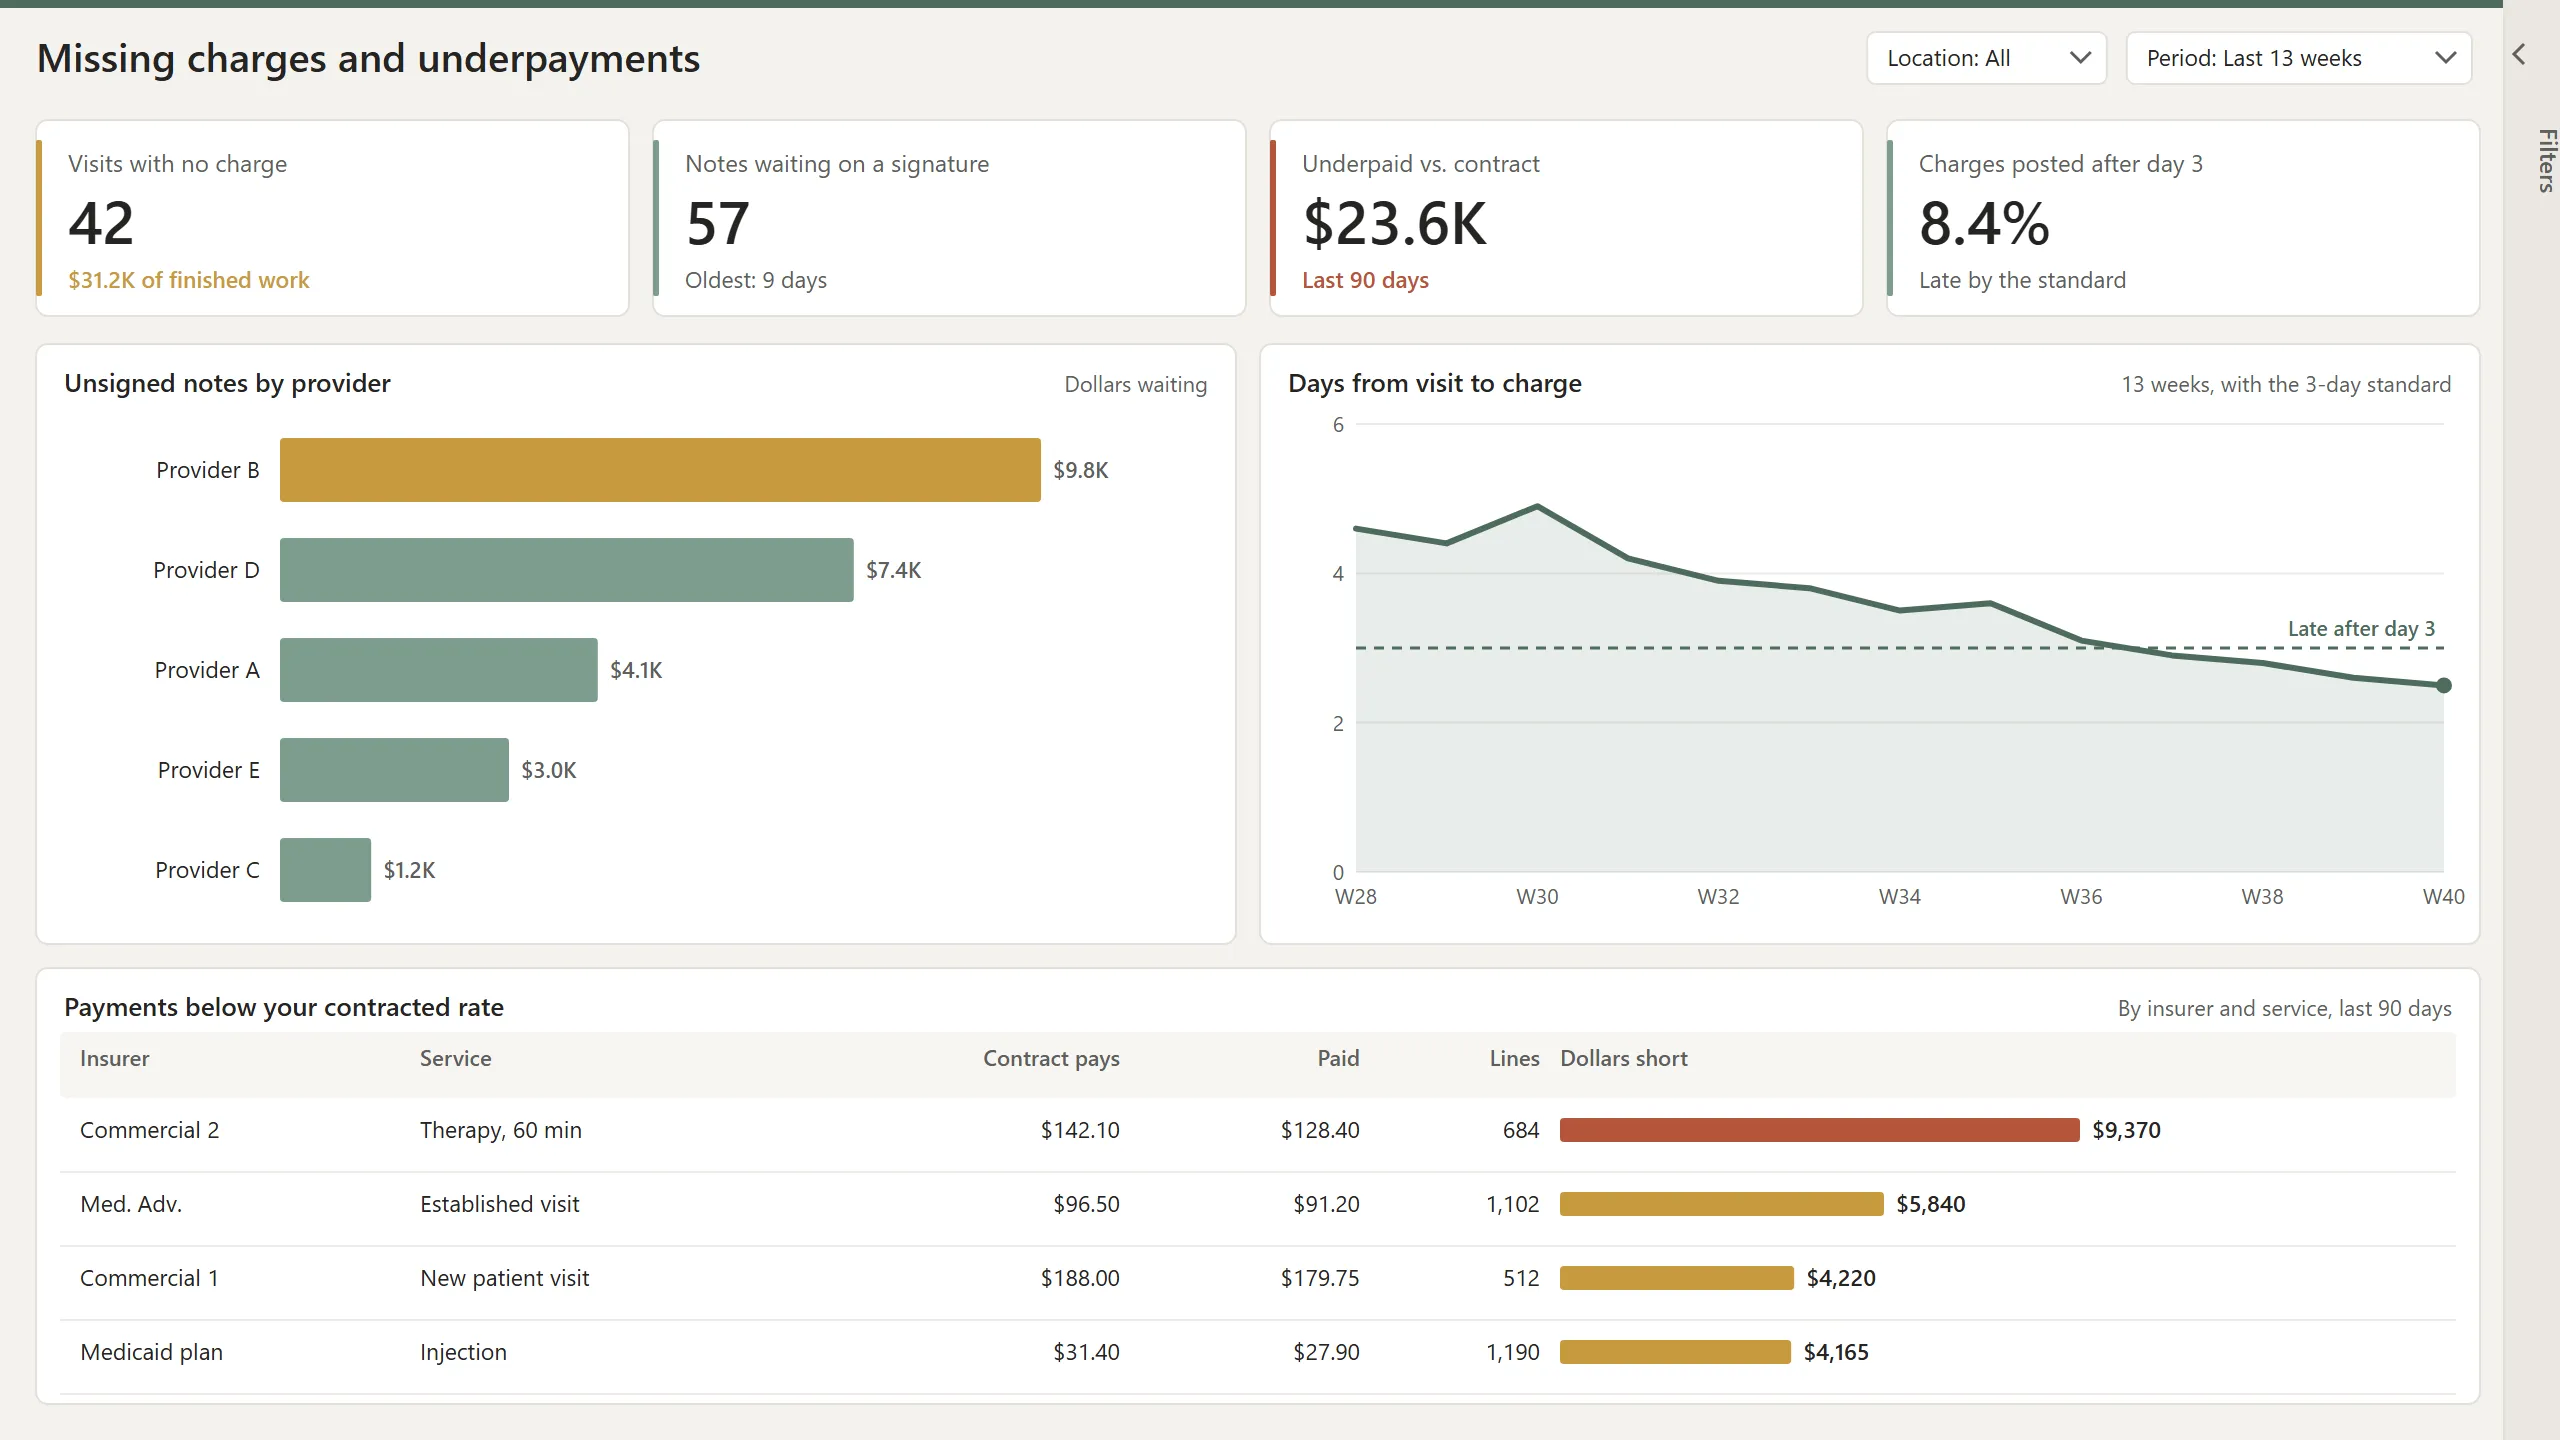
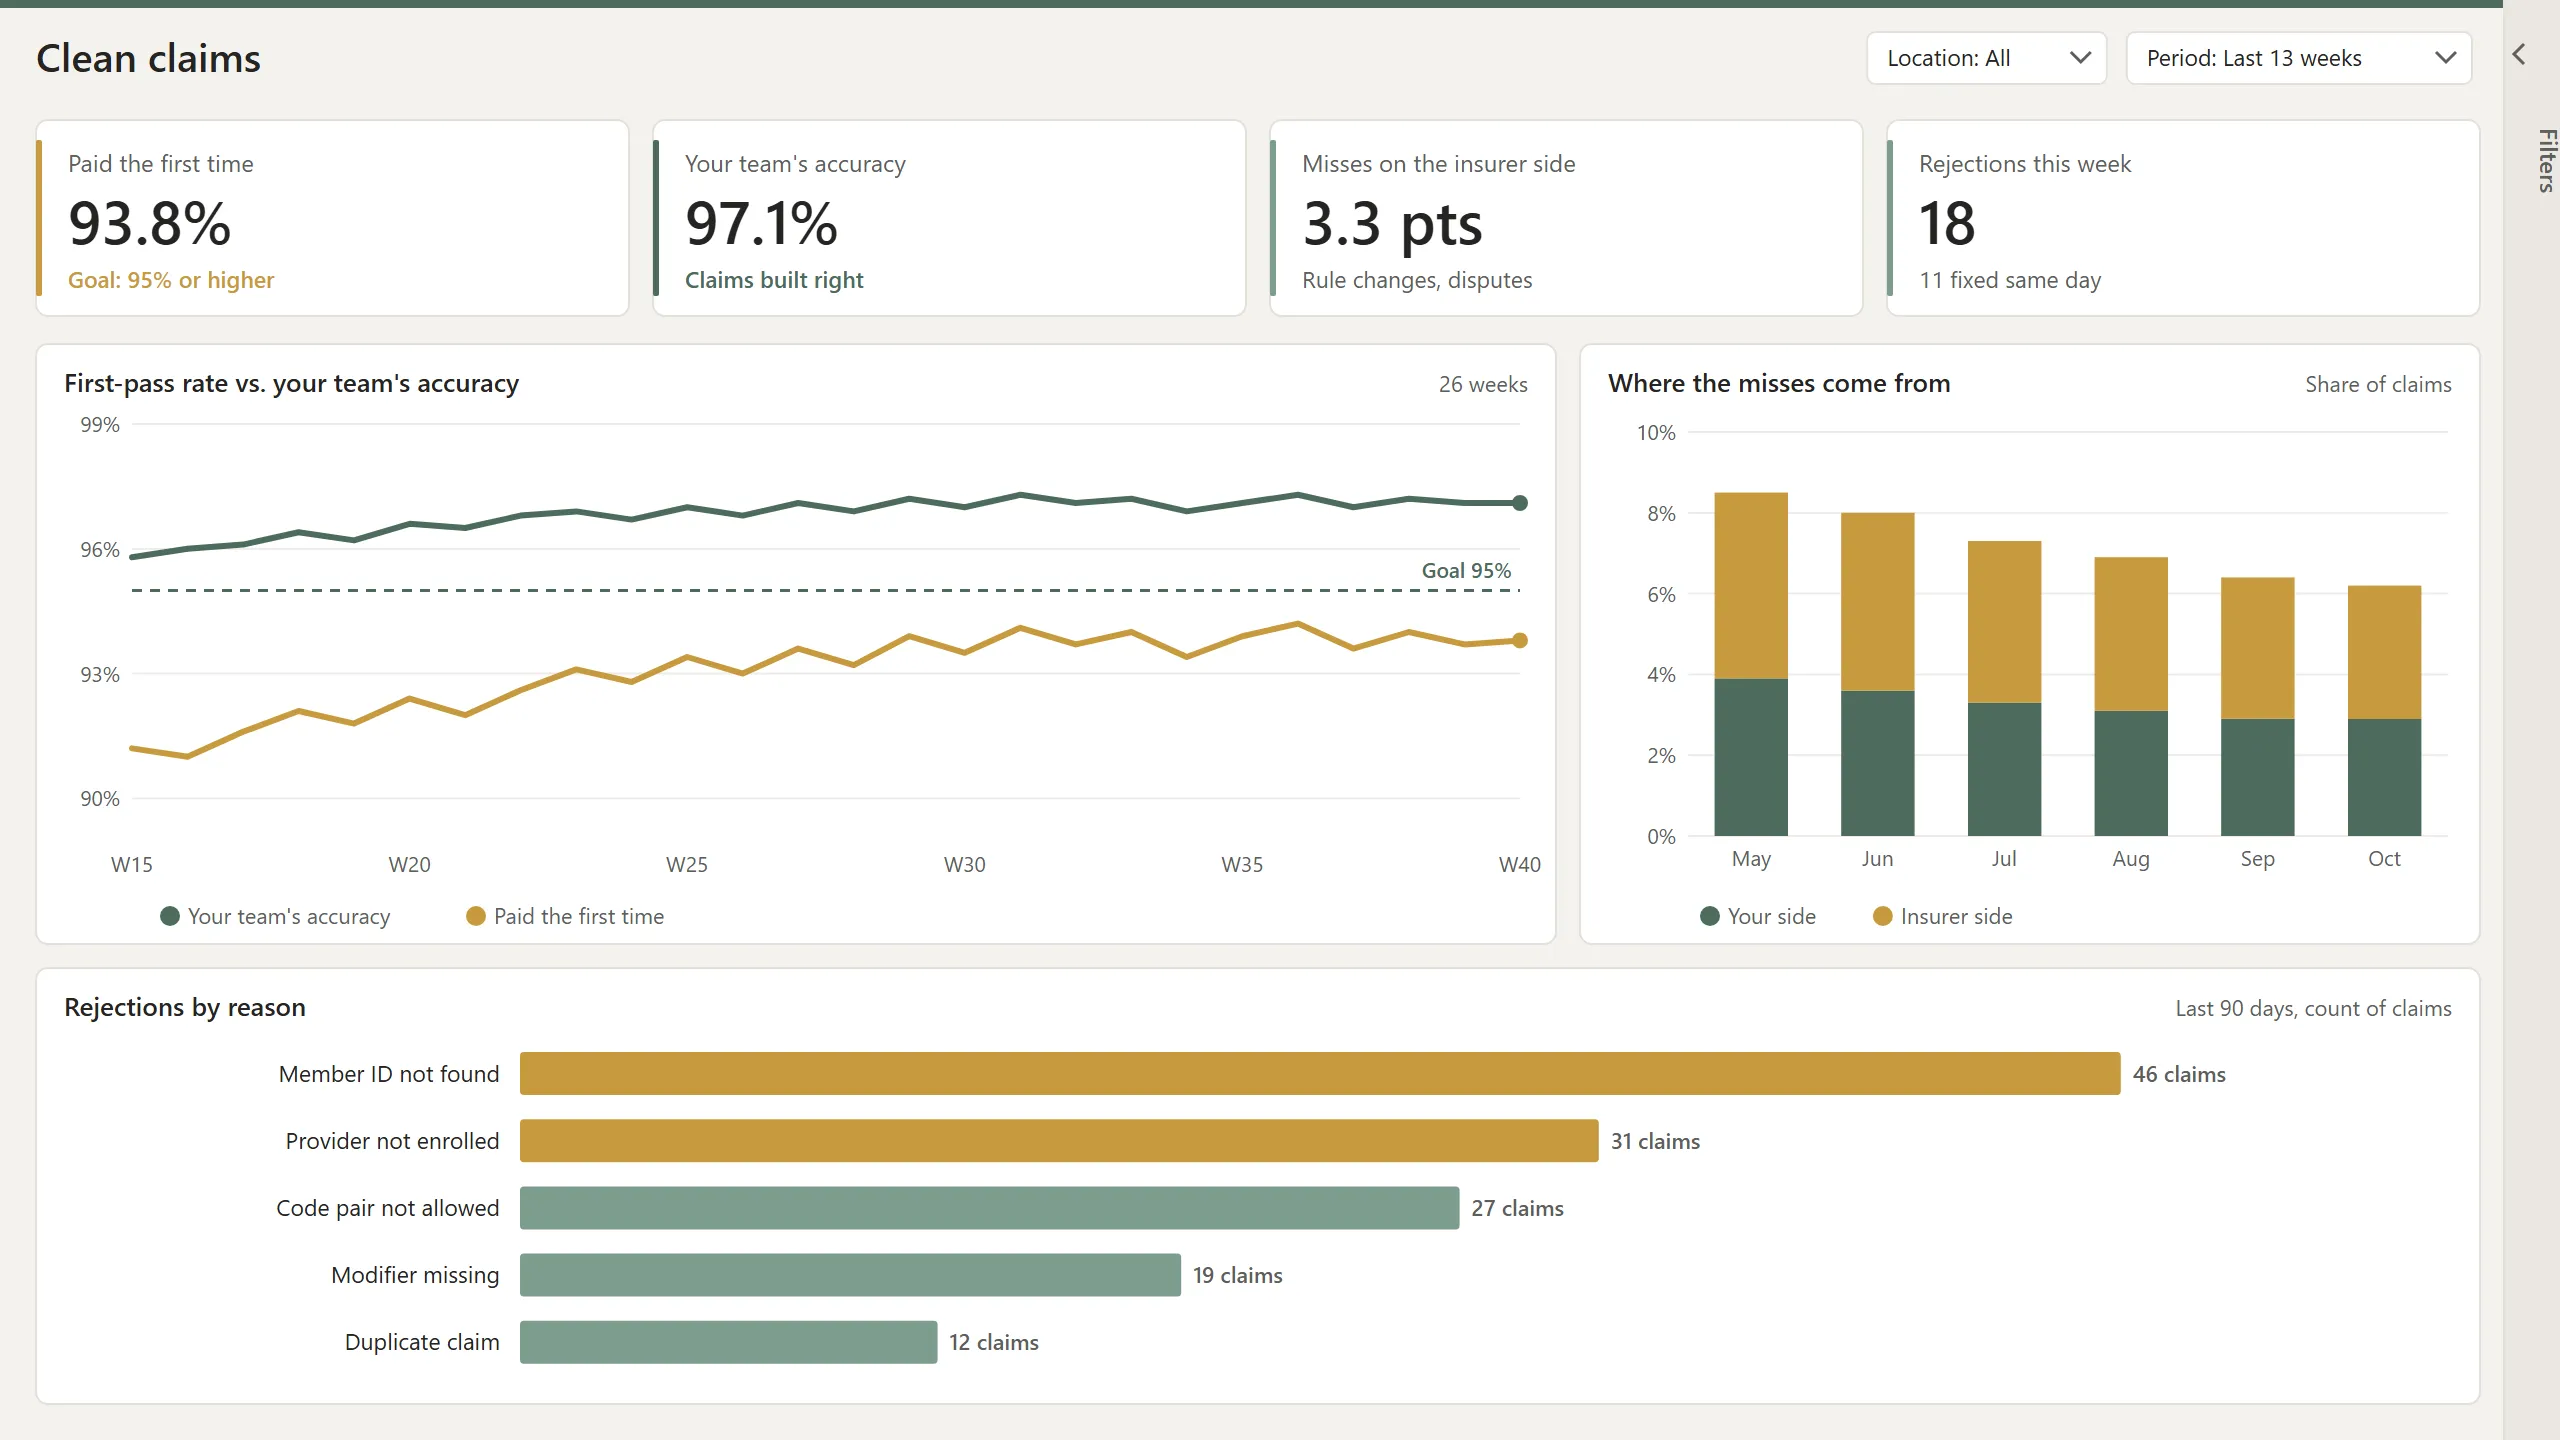
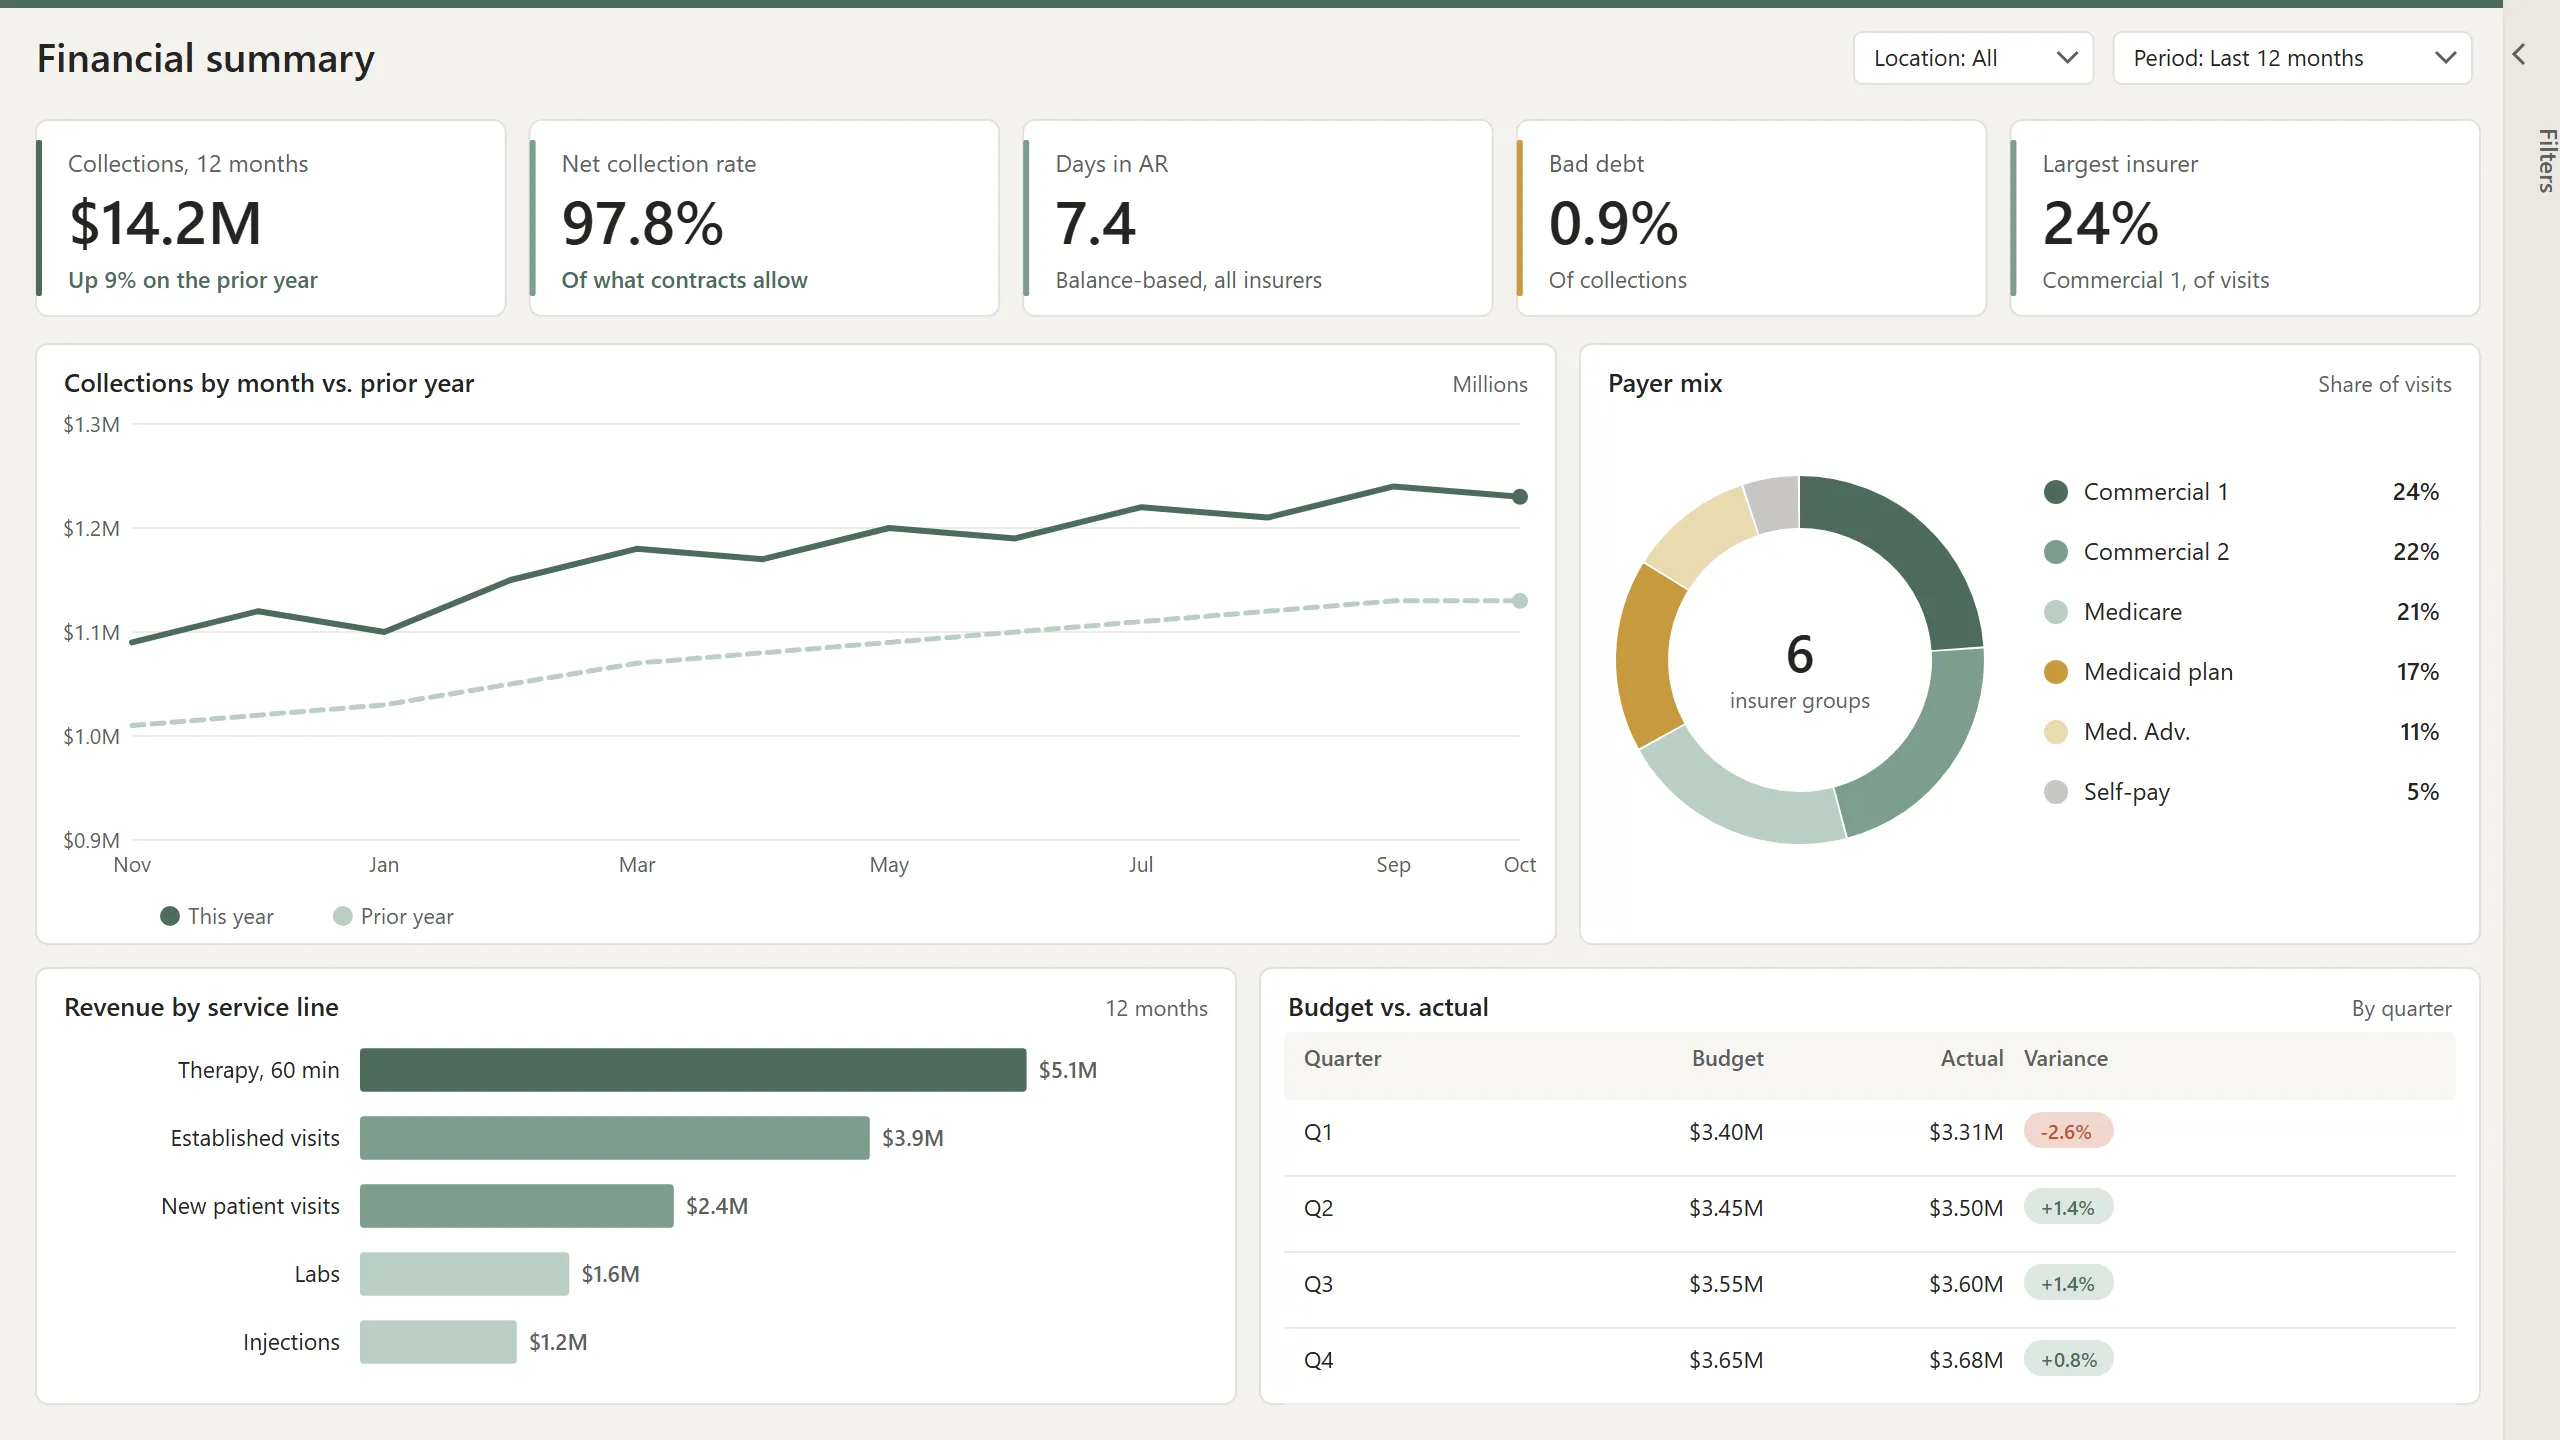
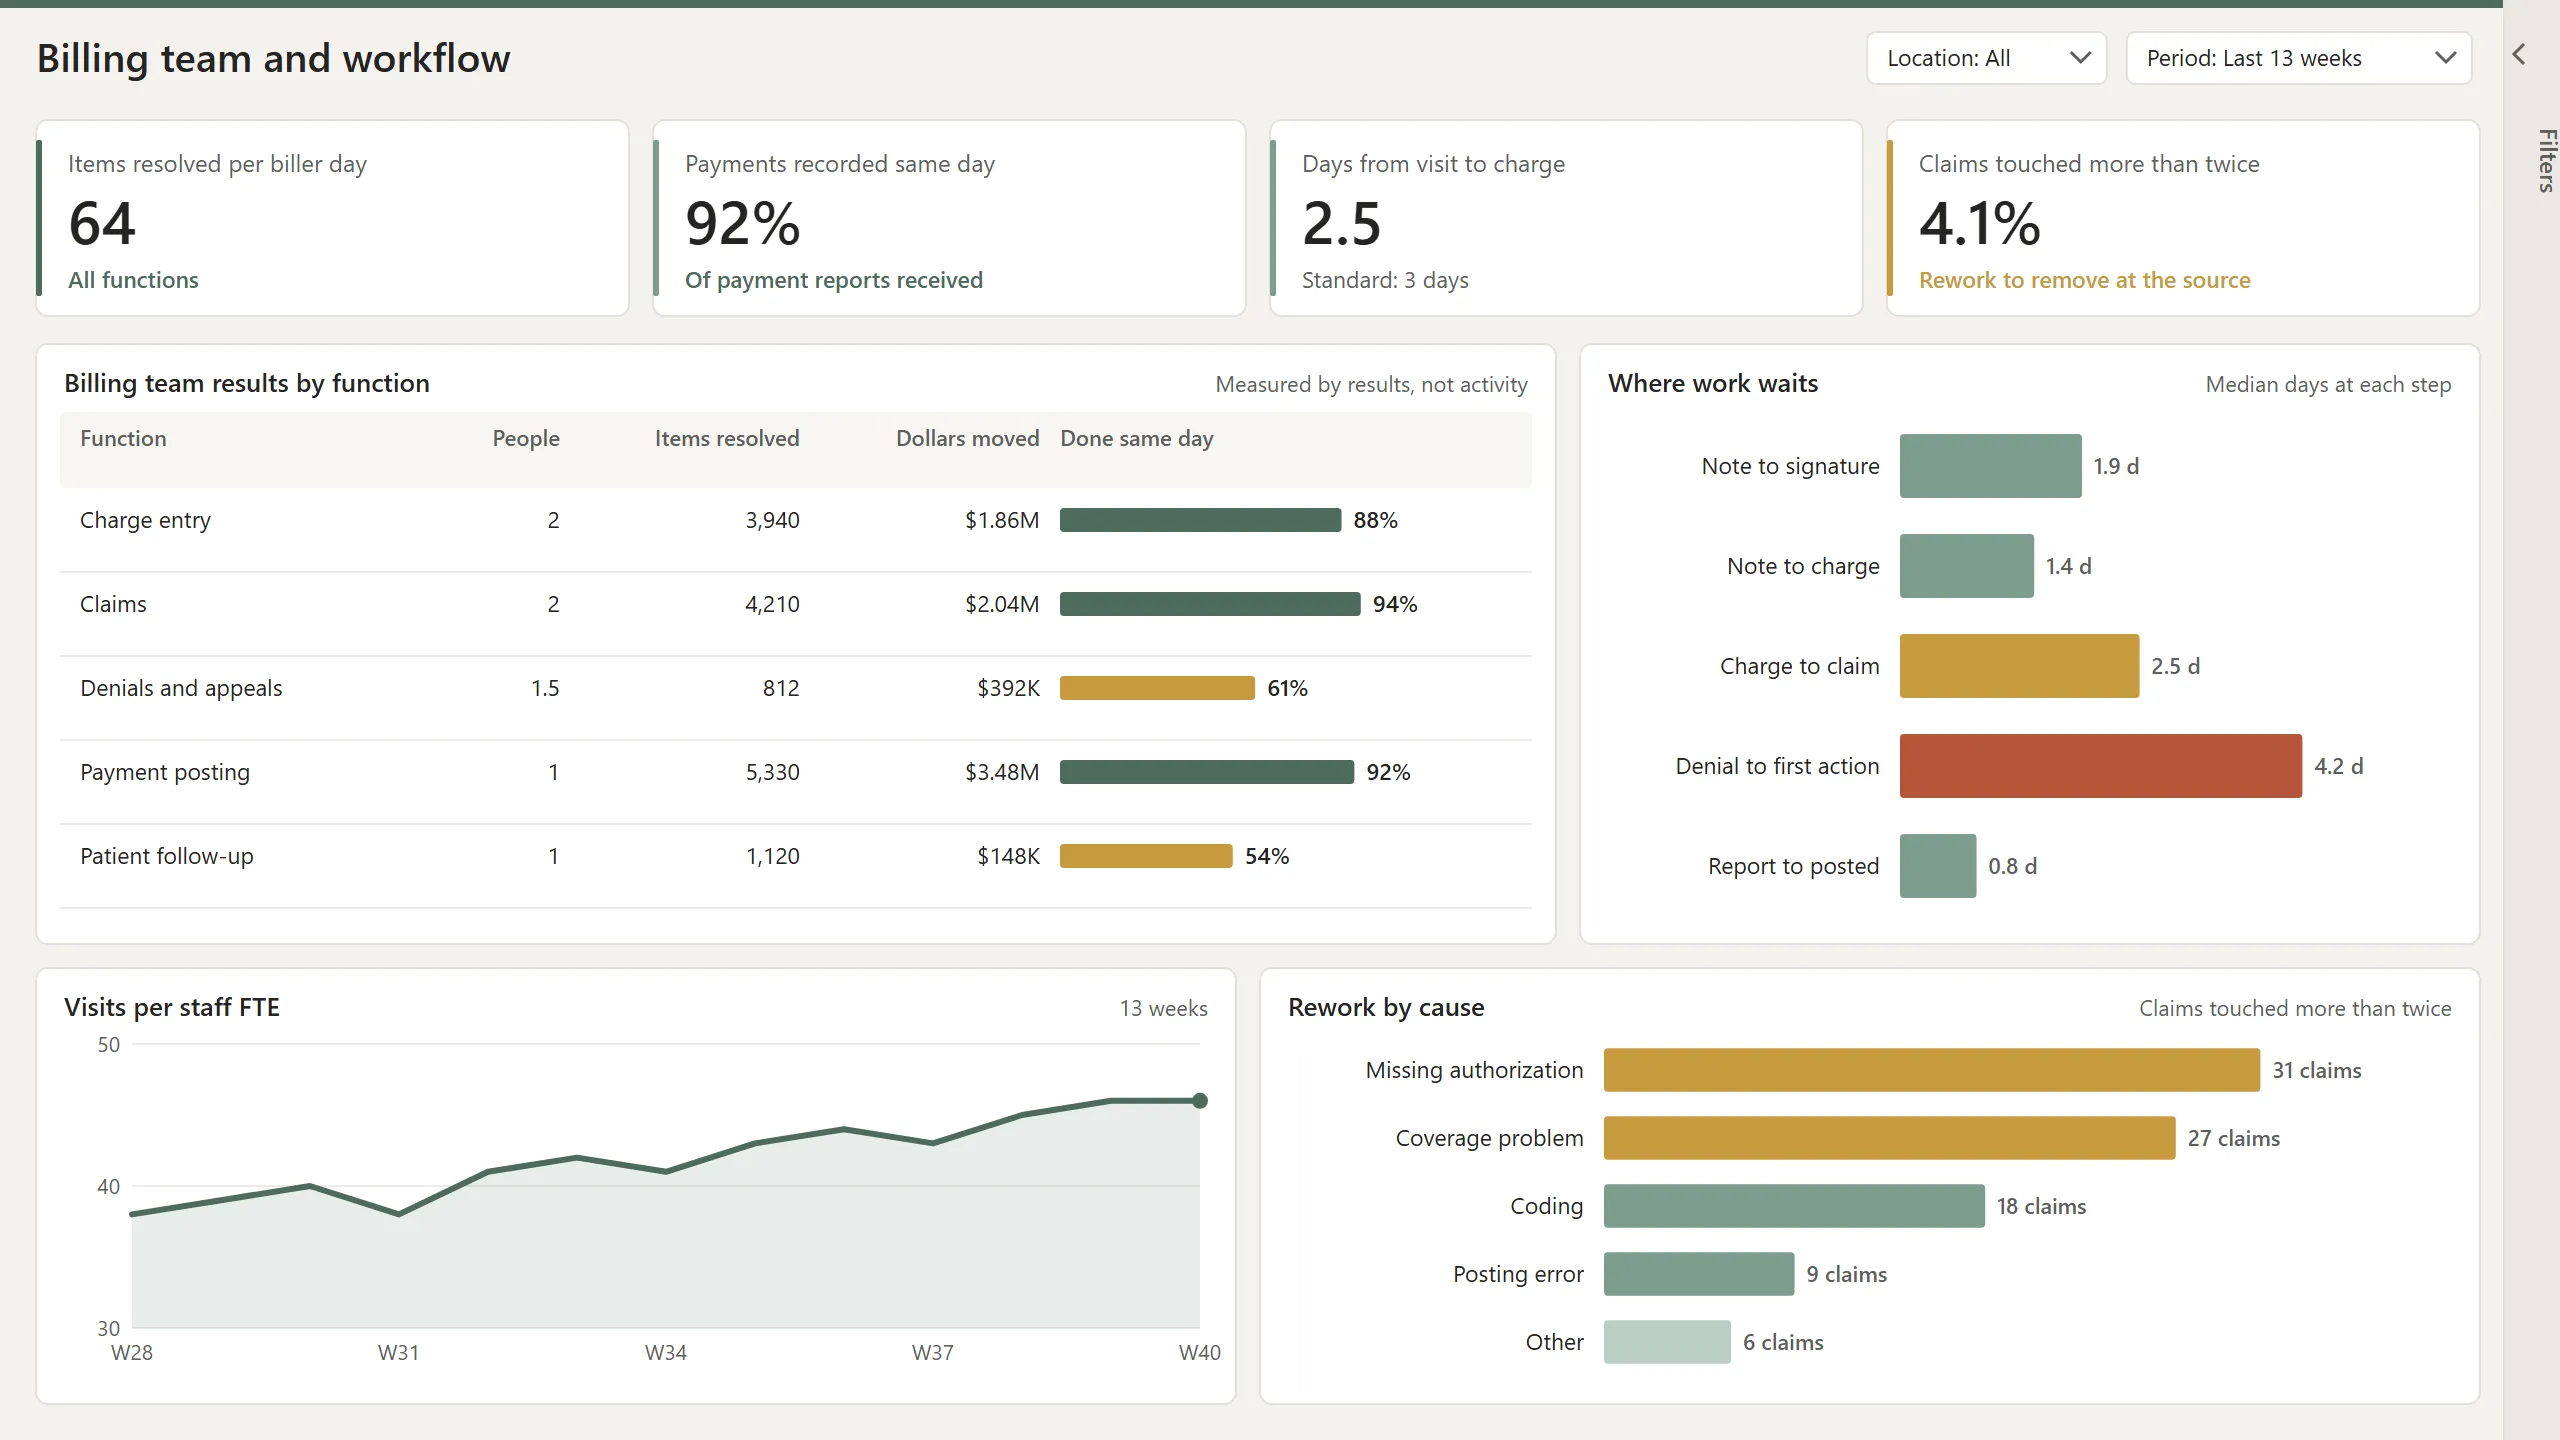
Eight pages from one report: the morning board, speed to cash, insurance AR, denials, clean claims, appointments, missing charges and underpayments, and referrals. Click a tab to move between them. Data and reports vary by practice.
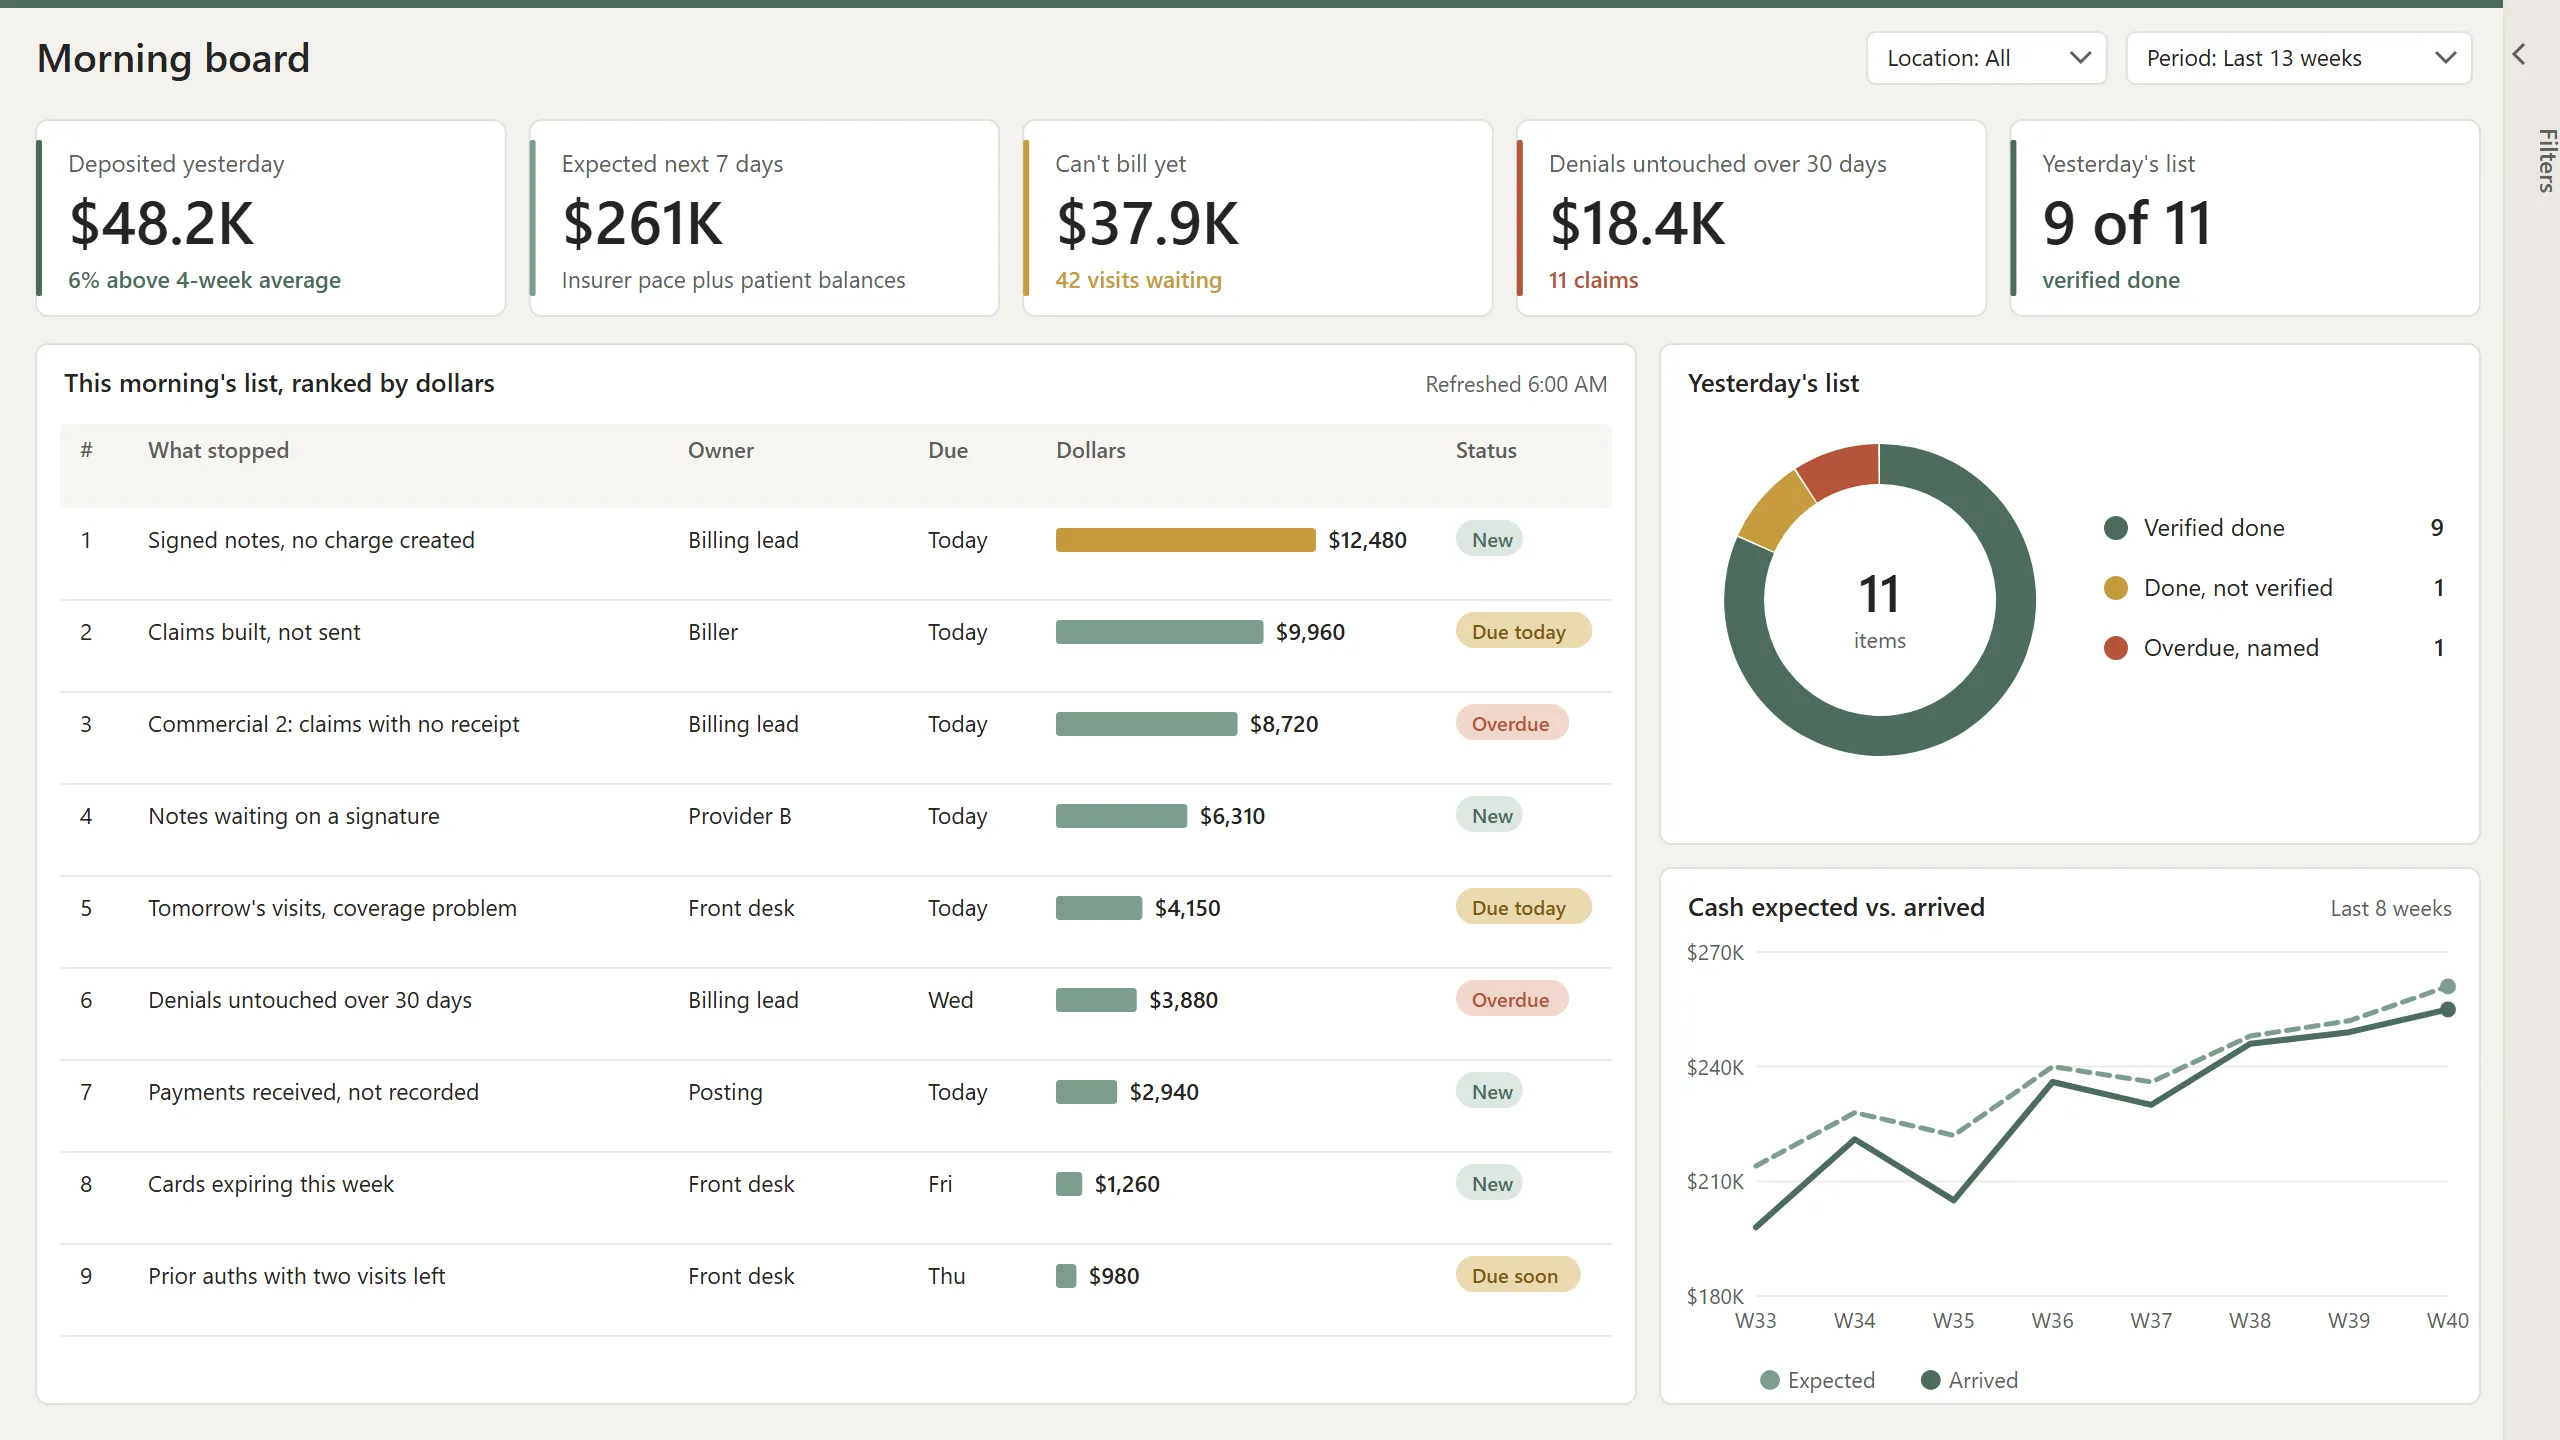
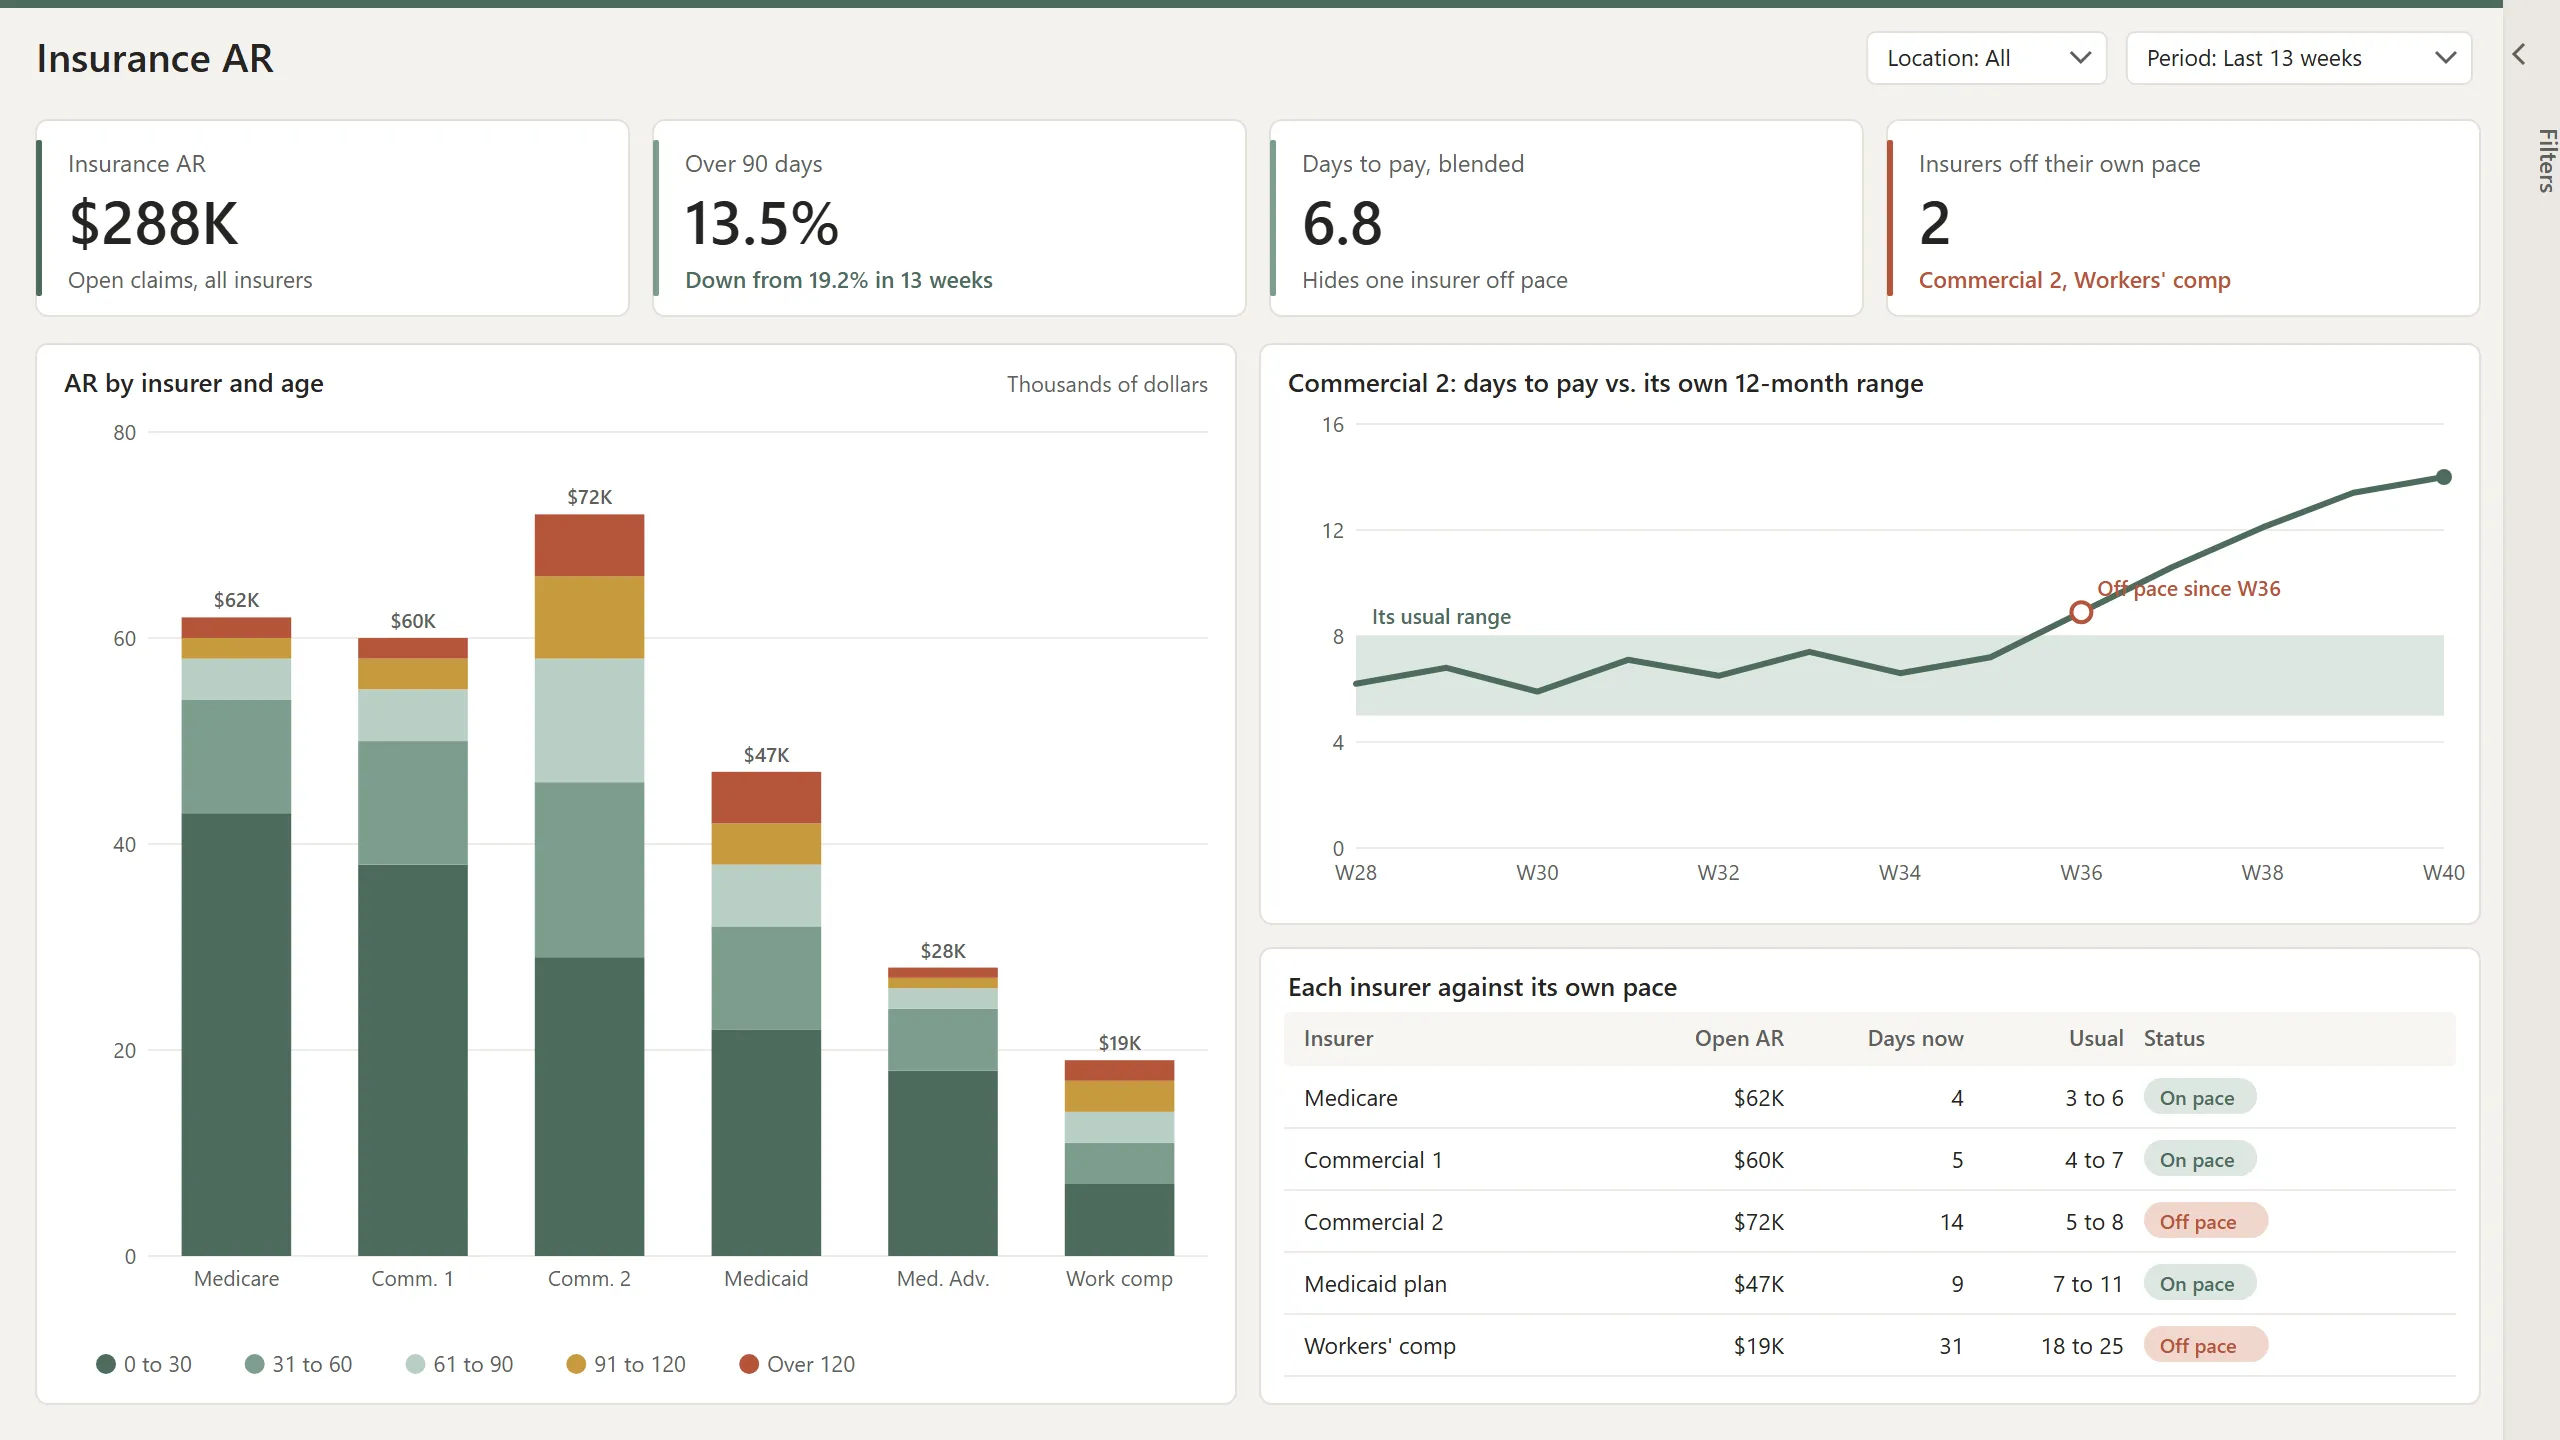
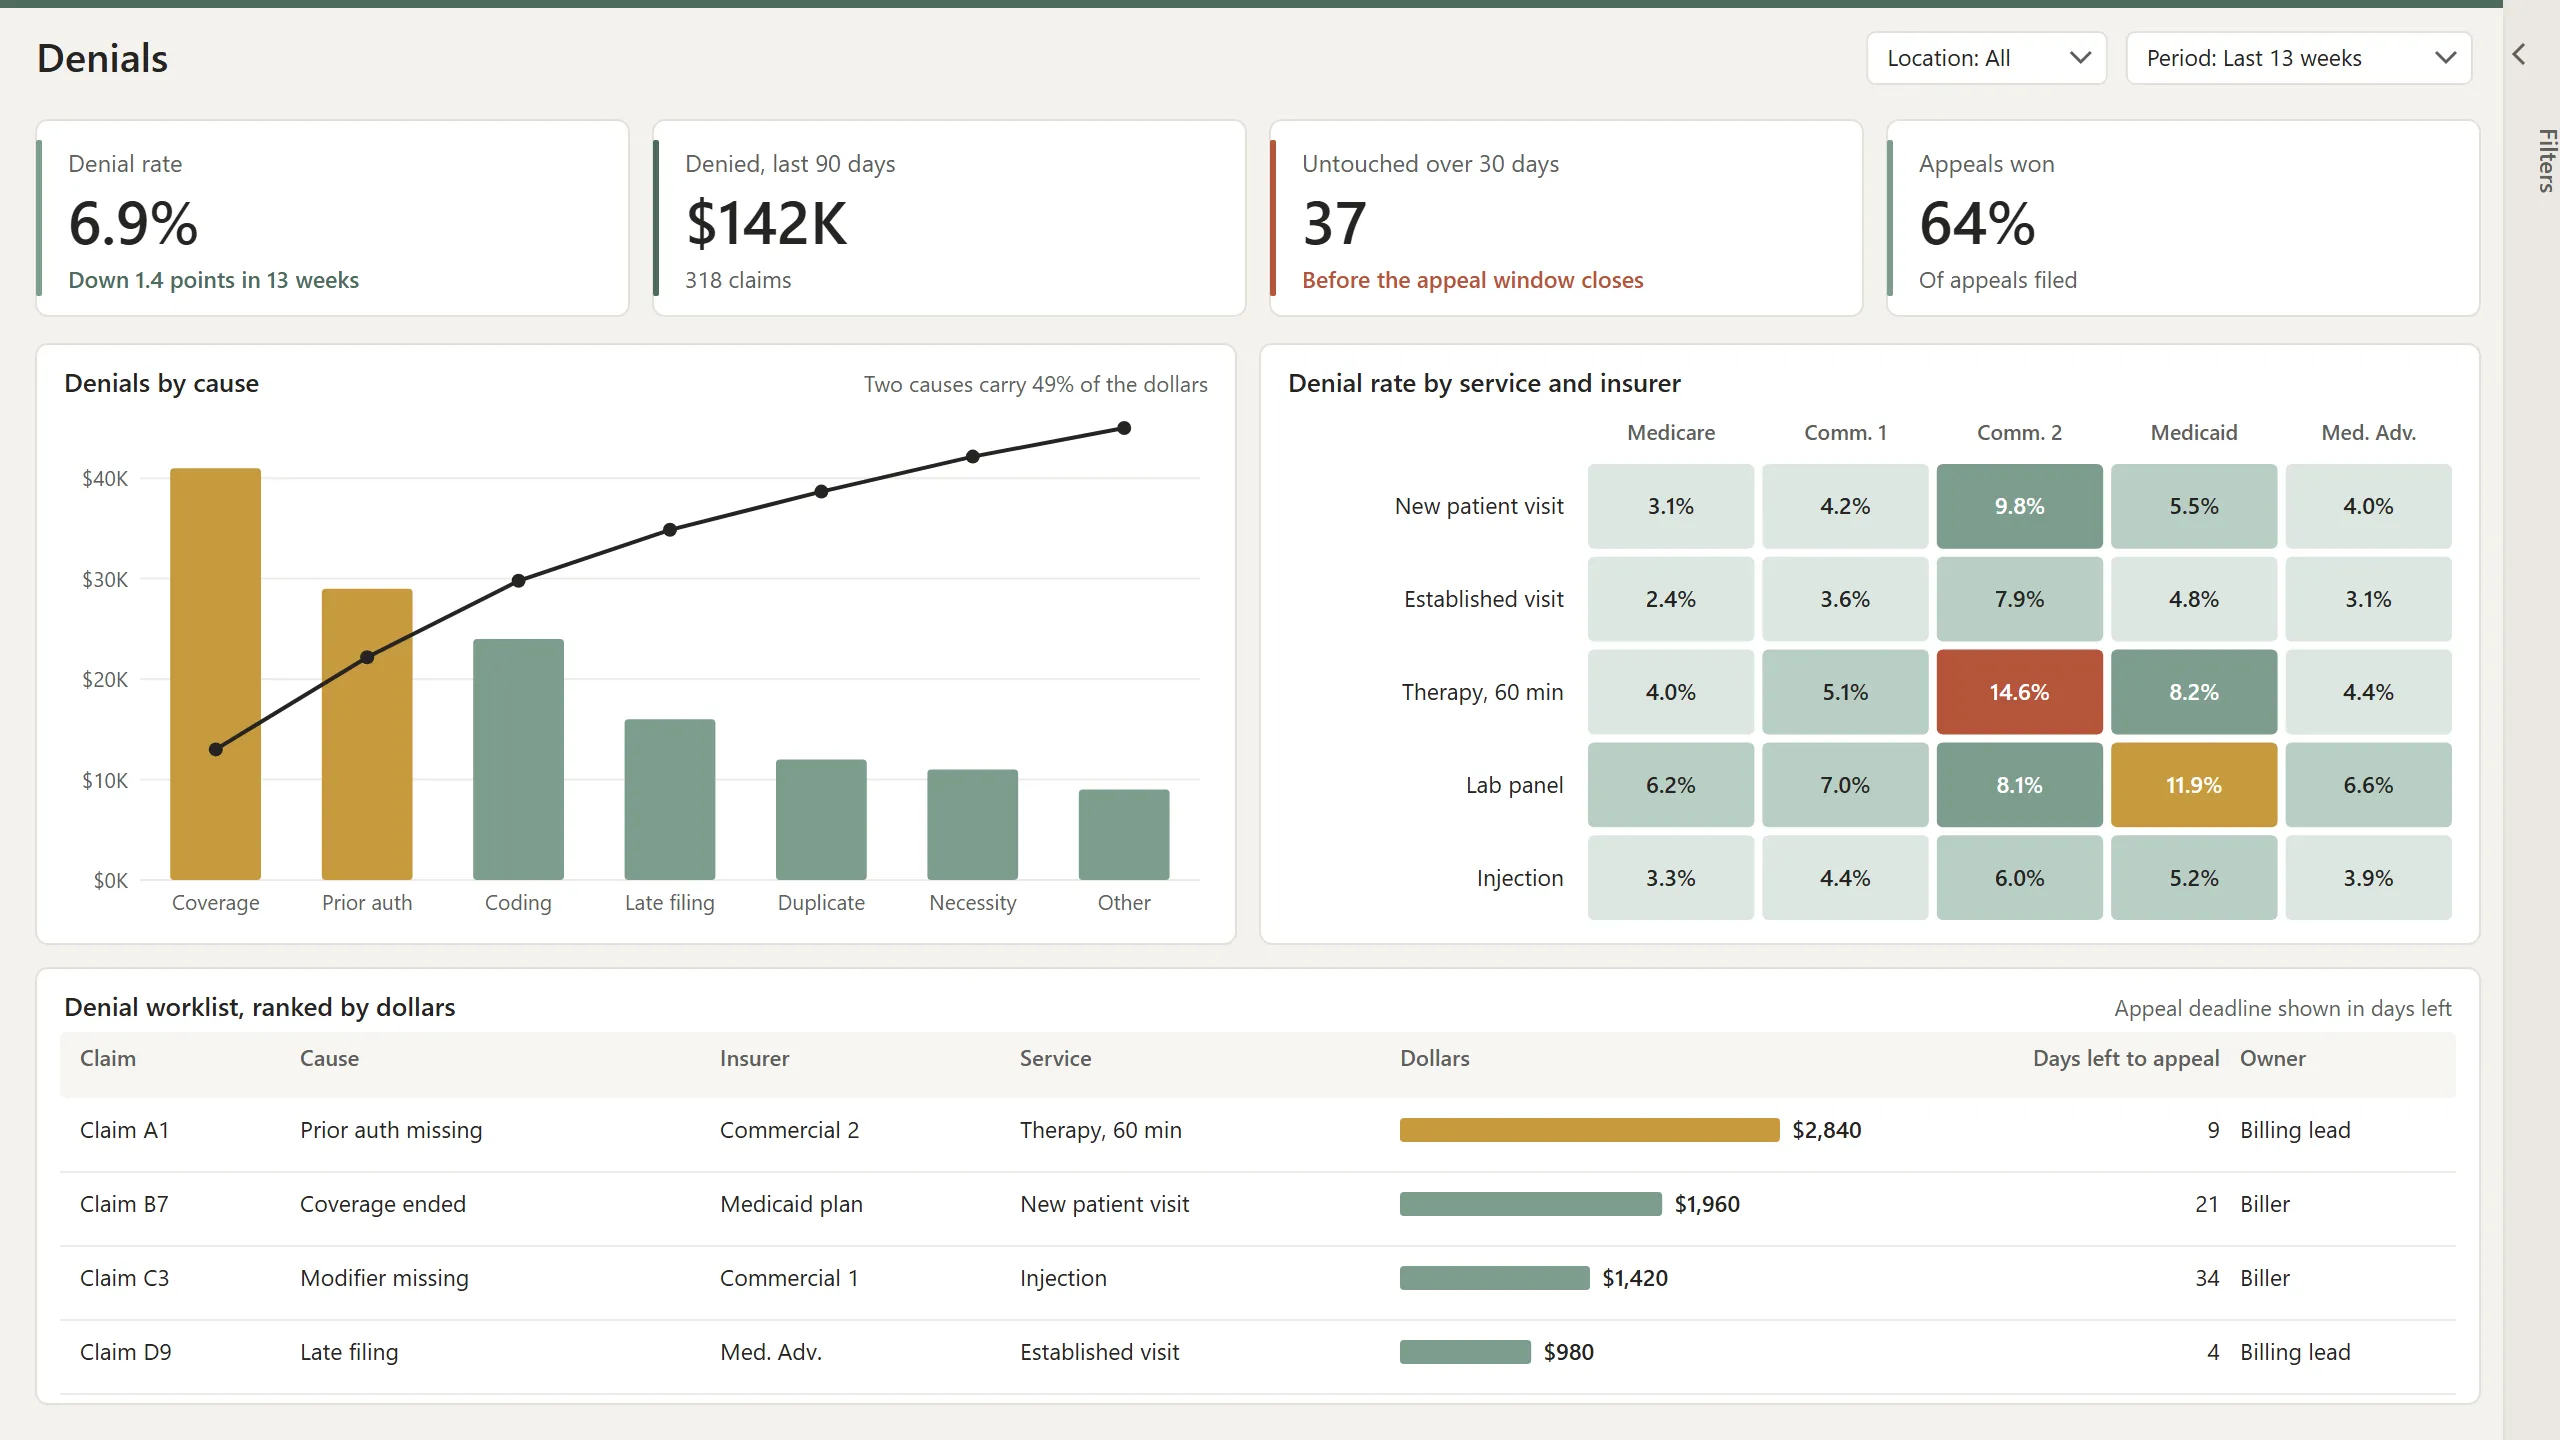
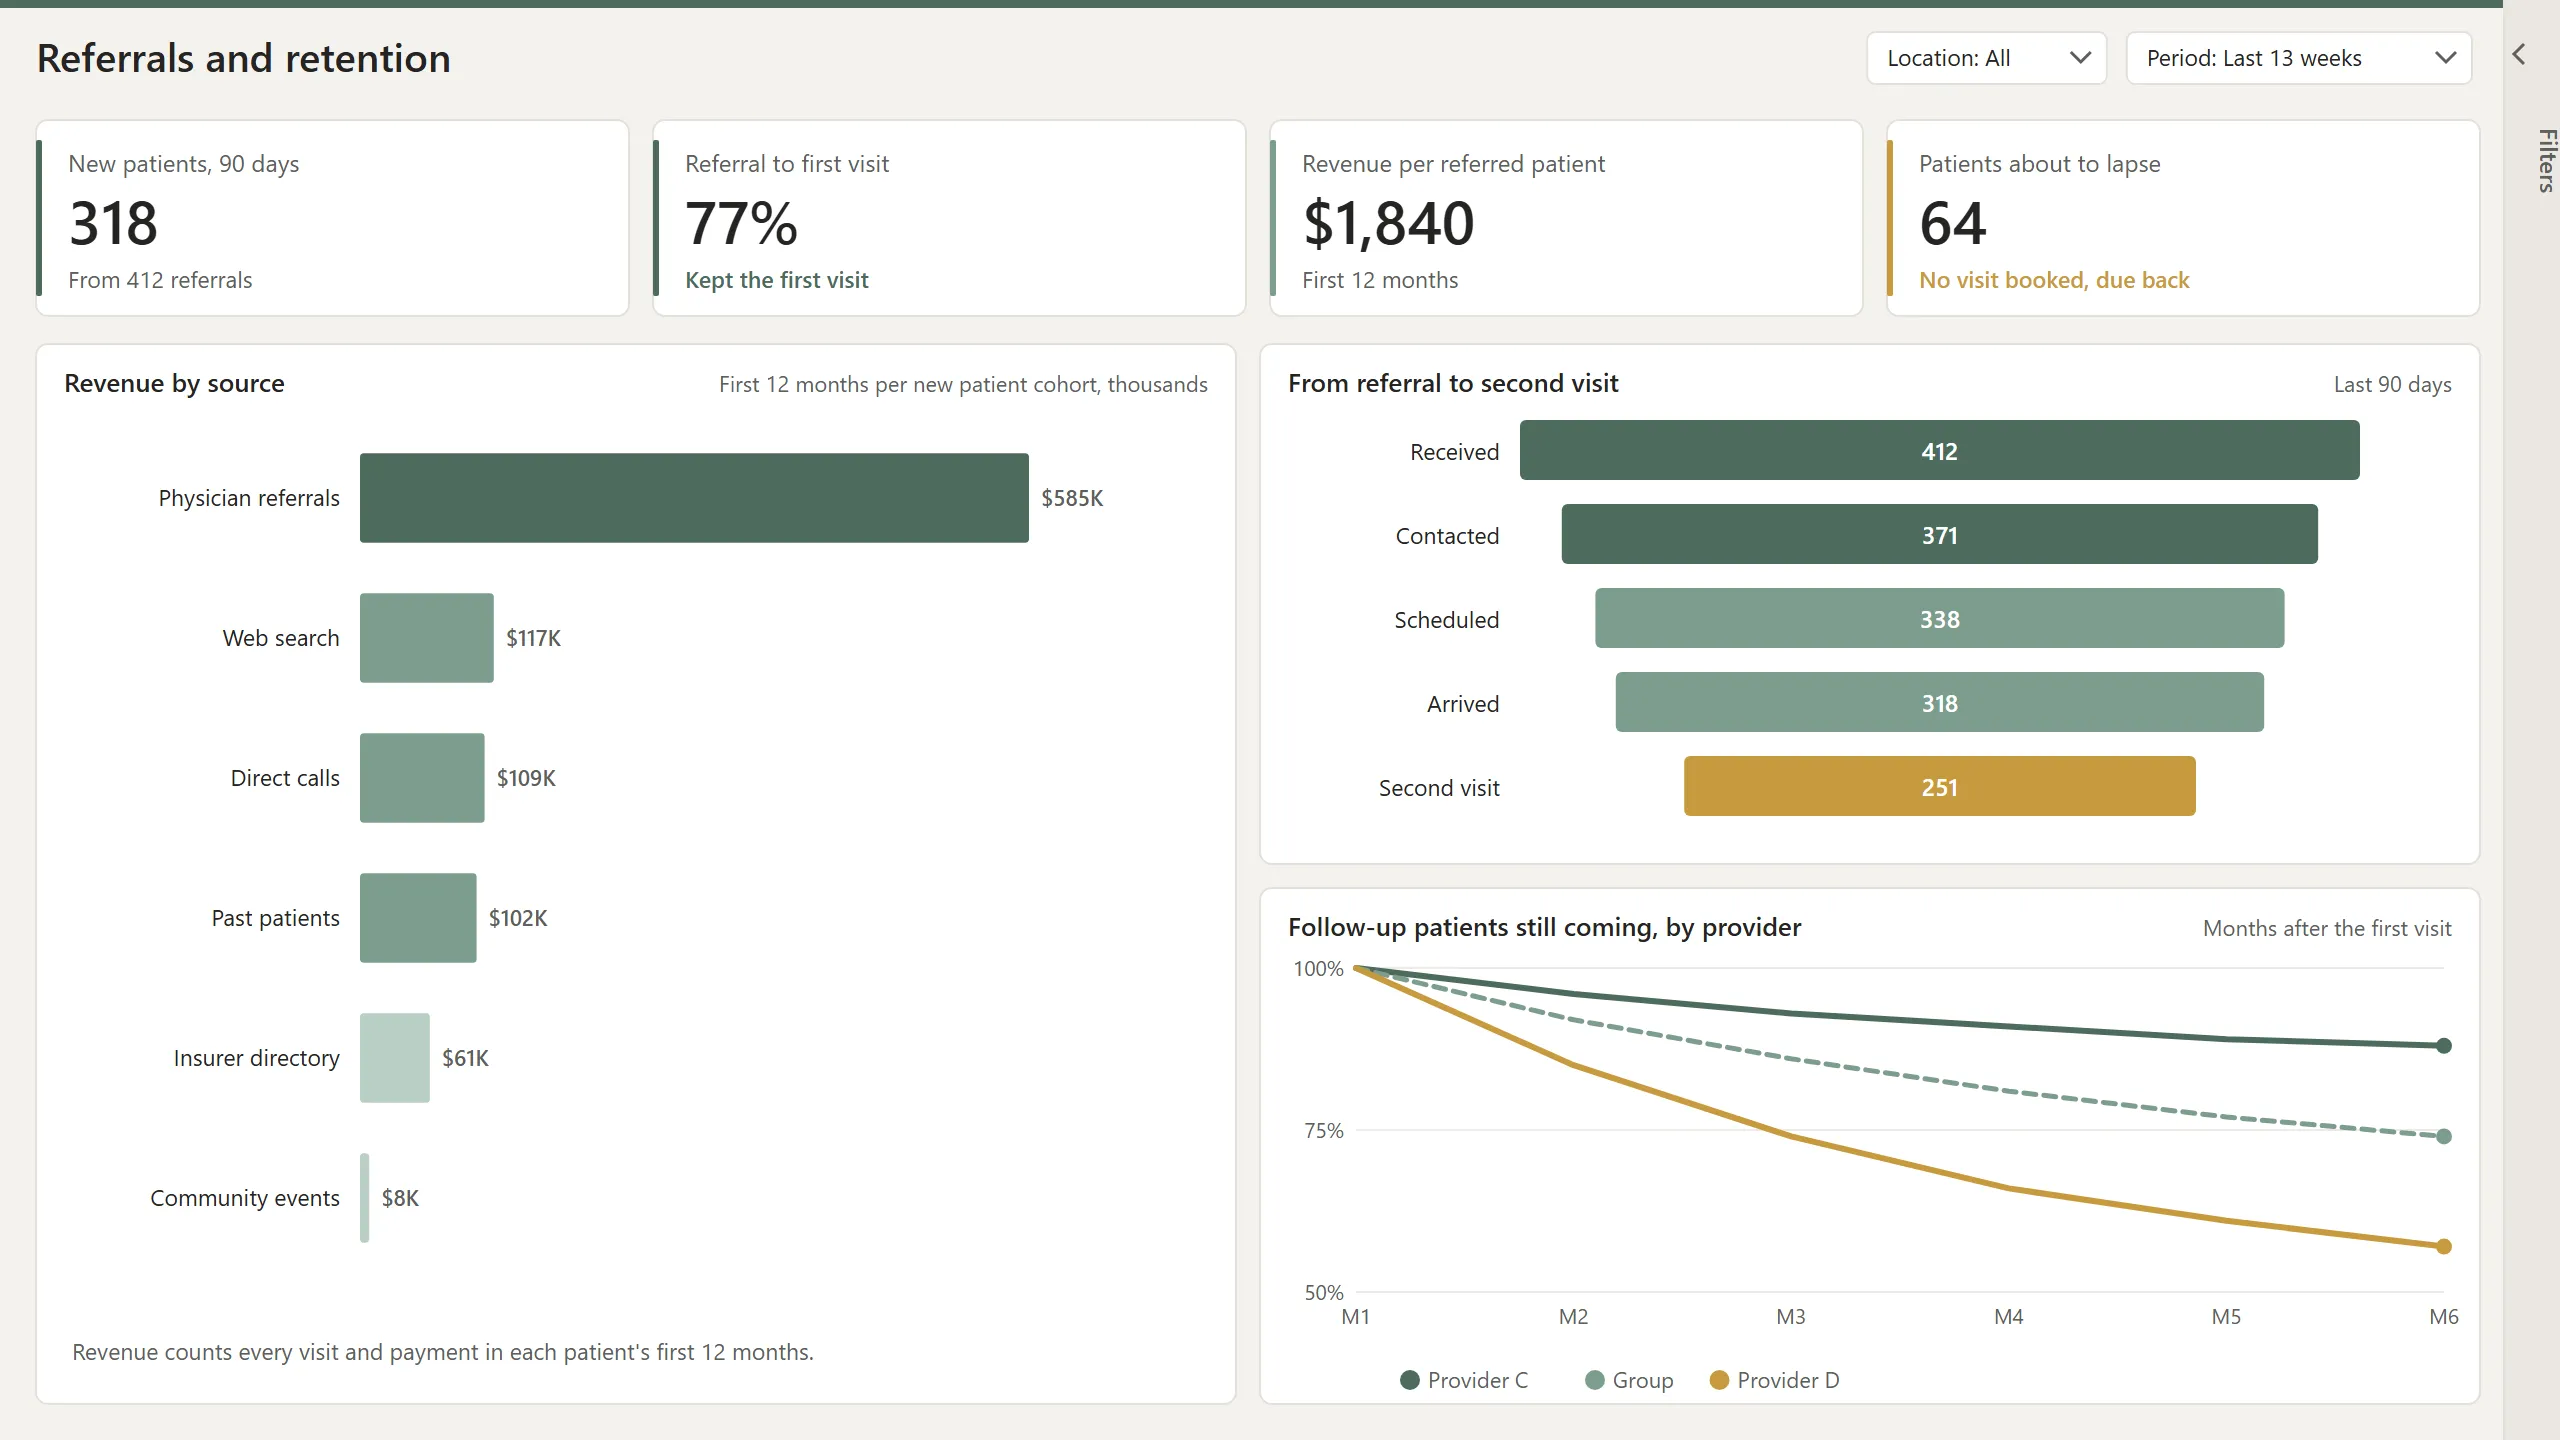
Data and reports vary by practice. Your reports run on your own AdvancedMD data, refreshed overnight, with each person seeing only what they're allowed to see.
Ask for any report. If you don't see it, we build it.
This is the range, across financial, operational, clinical, measurement-based care, patient, analysis, and connected systems, built on your AdvancedMD data. Every report below is tied to an outcome, not just a number on a screen.
Revenue cycle metrics (days in AR, submission and acceptance rates, denial rates). Cash flow and cash conversion. Operating cost per provider and per patient. Year-to-date revenue, expense, and profit summaries. Accounts receivable aging and A/R day comparisons. Provider productivity and revenue per patient. Payment trend and collection reports. Insurance collection and payer reimbursement analysis. Profitability and net margin. Cost-benefit analysis. Budget versus actual. Revenue by service, location, and provider. Missing charge slips. Unbilled patient notes. Charge posting and billing lag time. Up-front fee leakage. Copay, co-insurance, and deductible collection. Patient-due collection. Collection ratios and AR turnover. Claims denial rates, clearinghouse rejection tracking, and denial tracking. Bad debt. Payer mix. Underpayments against contracted rates, by insurer and procedure code. Denial rates by procedure code, insurer, and provider, with appeal tracking.
Dynamic dashboards. Appointment scheduling attainment and projection. No-show and same-day appointment rates. Patient conversion rates for first and follow-up visits. Staff-to-patient ratio and FTE staffing ratios. Staff performance and productivity. Resource allocation and utilization. Workflow and bottleneck analysis. Expense management. Compliance and security tracking. KPI reporting. Provider billing and collections. Physician and APP wRVU productivity, total encounters, and panel size. Patient portal use. Capacity and scheduling efficiency. Billing team productivity by function, measured by results. Worklists by age, balance, insurer, and denial reason. Trends adjusted for working days. Capacity: staffed, booked, and kept hours, and the visits you could add without hiring. Utilization by provider, weekday, location, and visit type.
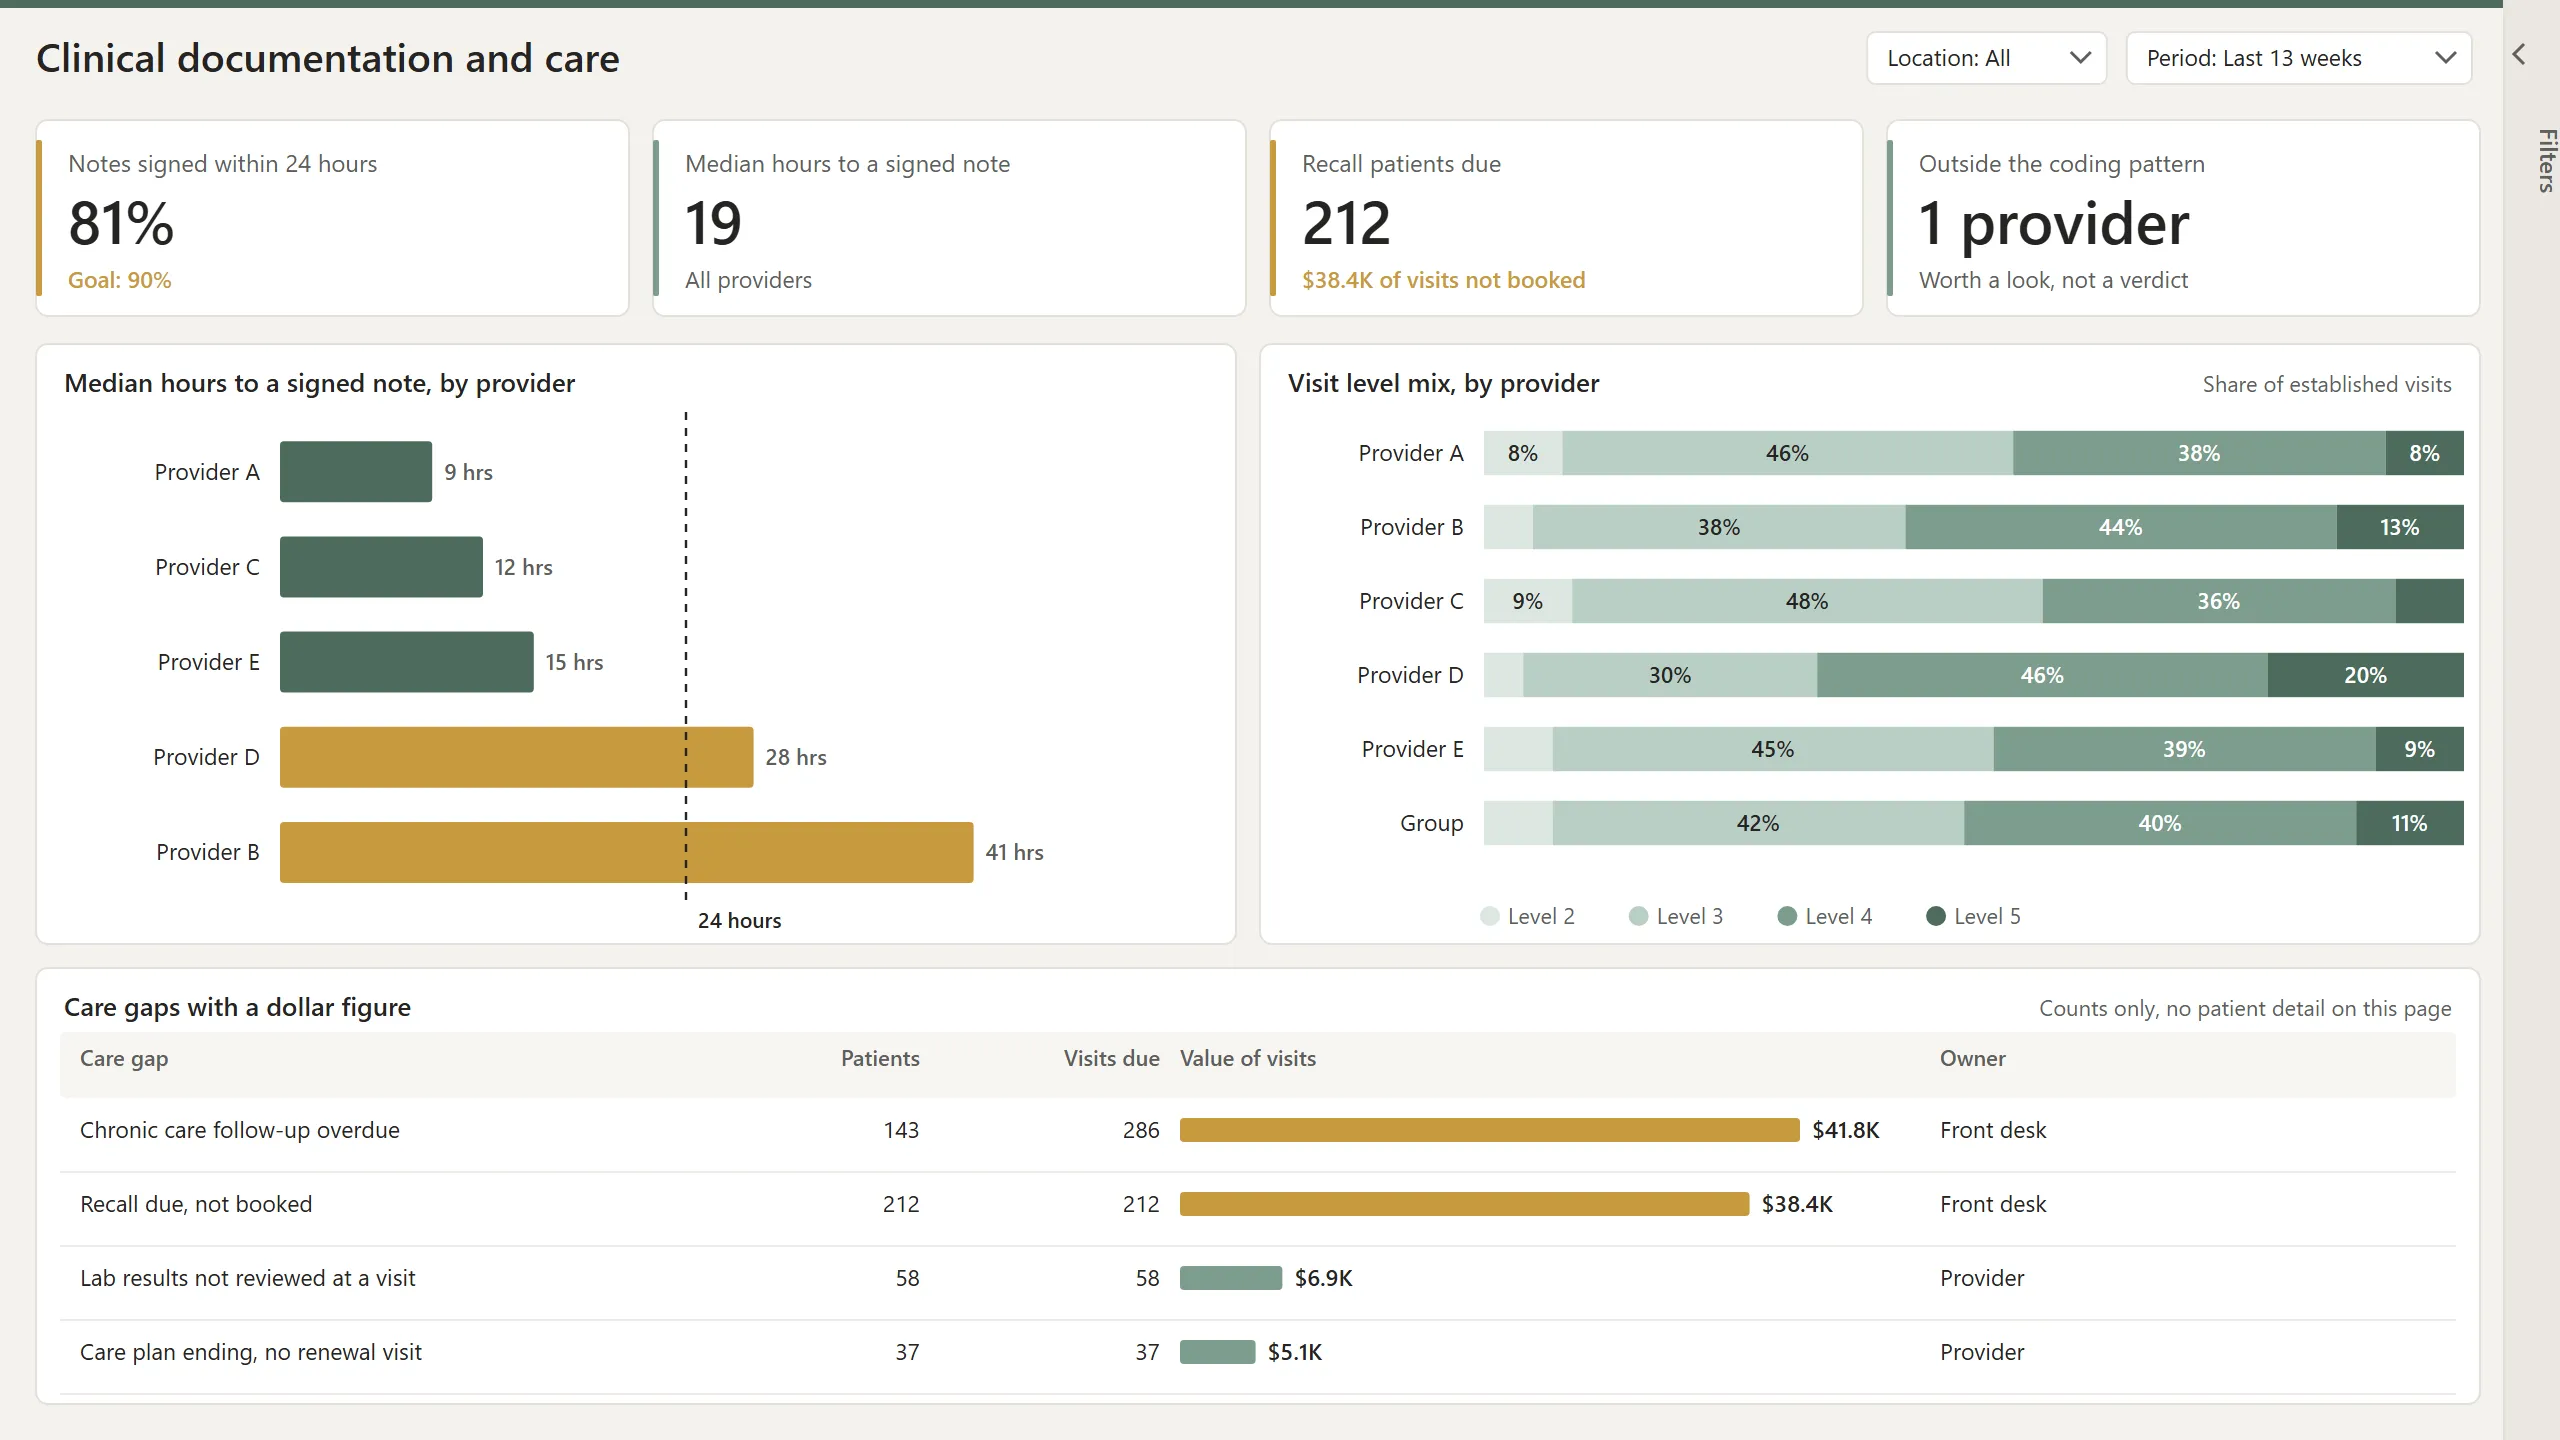
Patient care analytics. Clinical recall and follow-up management. Clinical note completeness and accuracy. Quality-of-care metrics. Clinical outcomes tracking. Patient safety metrics. Treatment protocol and guideline compliance. Clinical efficiency. Chronic disease management. Patient risk stratification. Prescription reporting. Procedure (CPT) and diagnosis code analysis. Insurance claim processing time. Average cost per discharge. Patient outcomes by provider and visit type, using the measures your clinicians already record. Care plan adherence: visits completed against the plan.
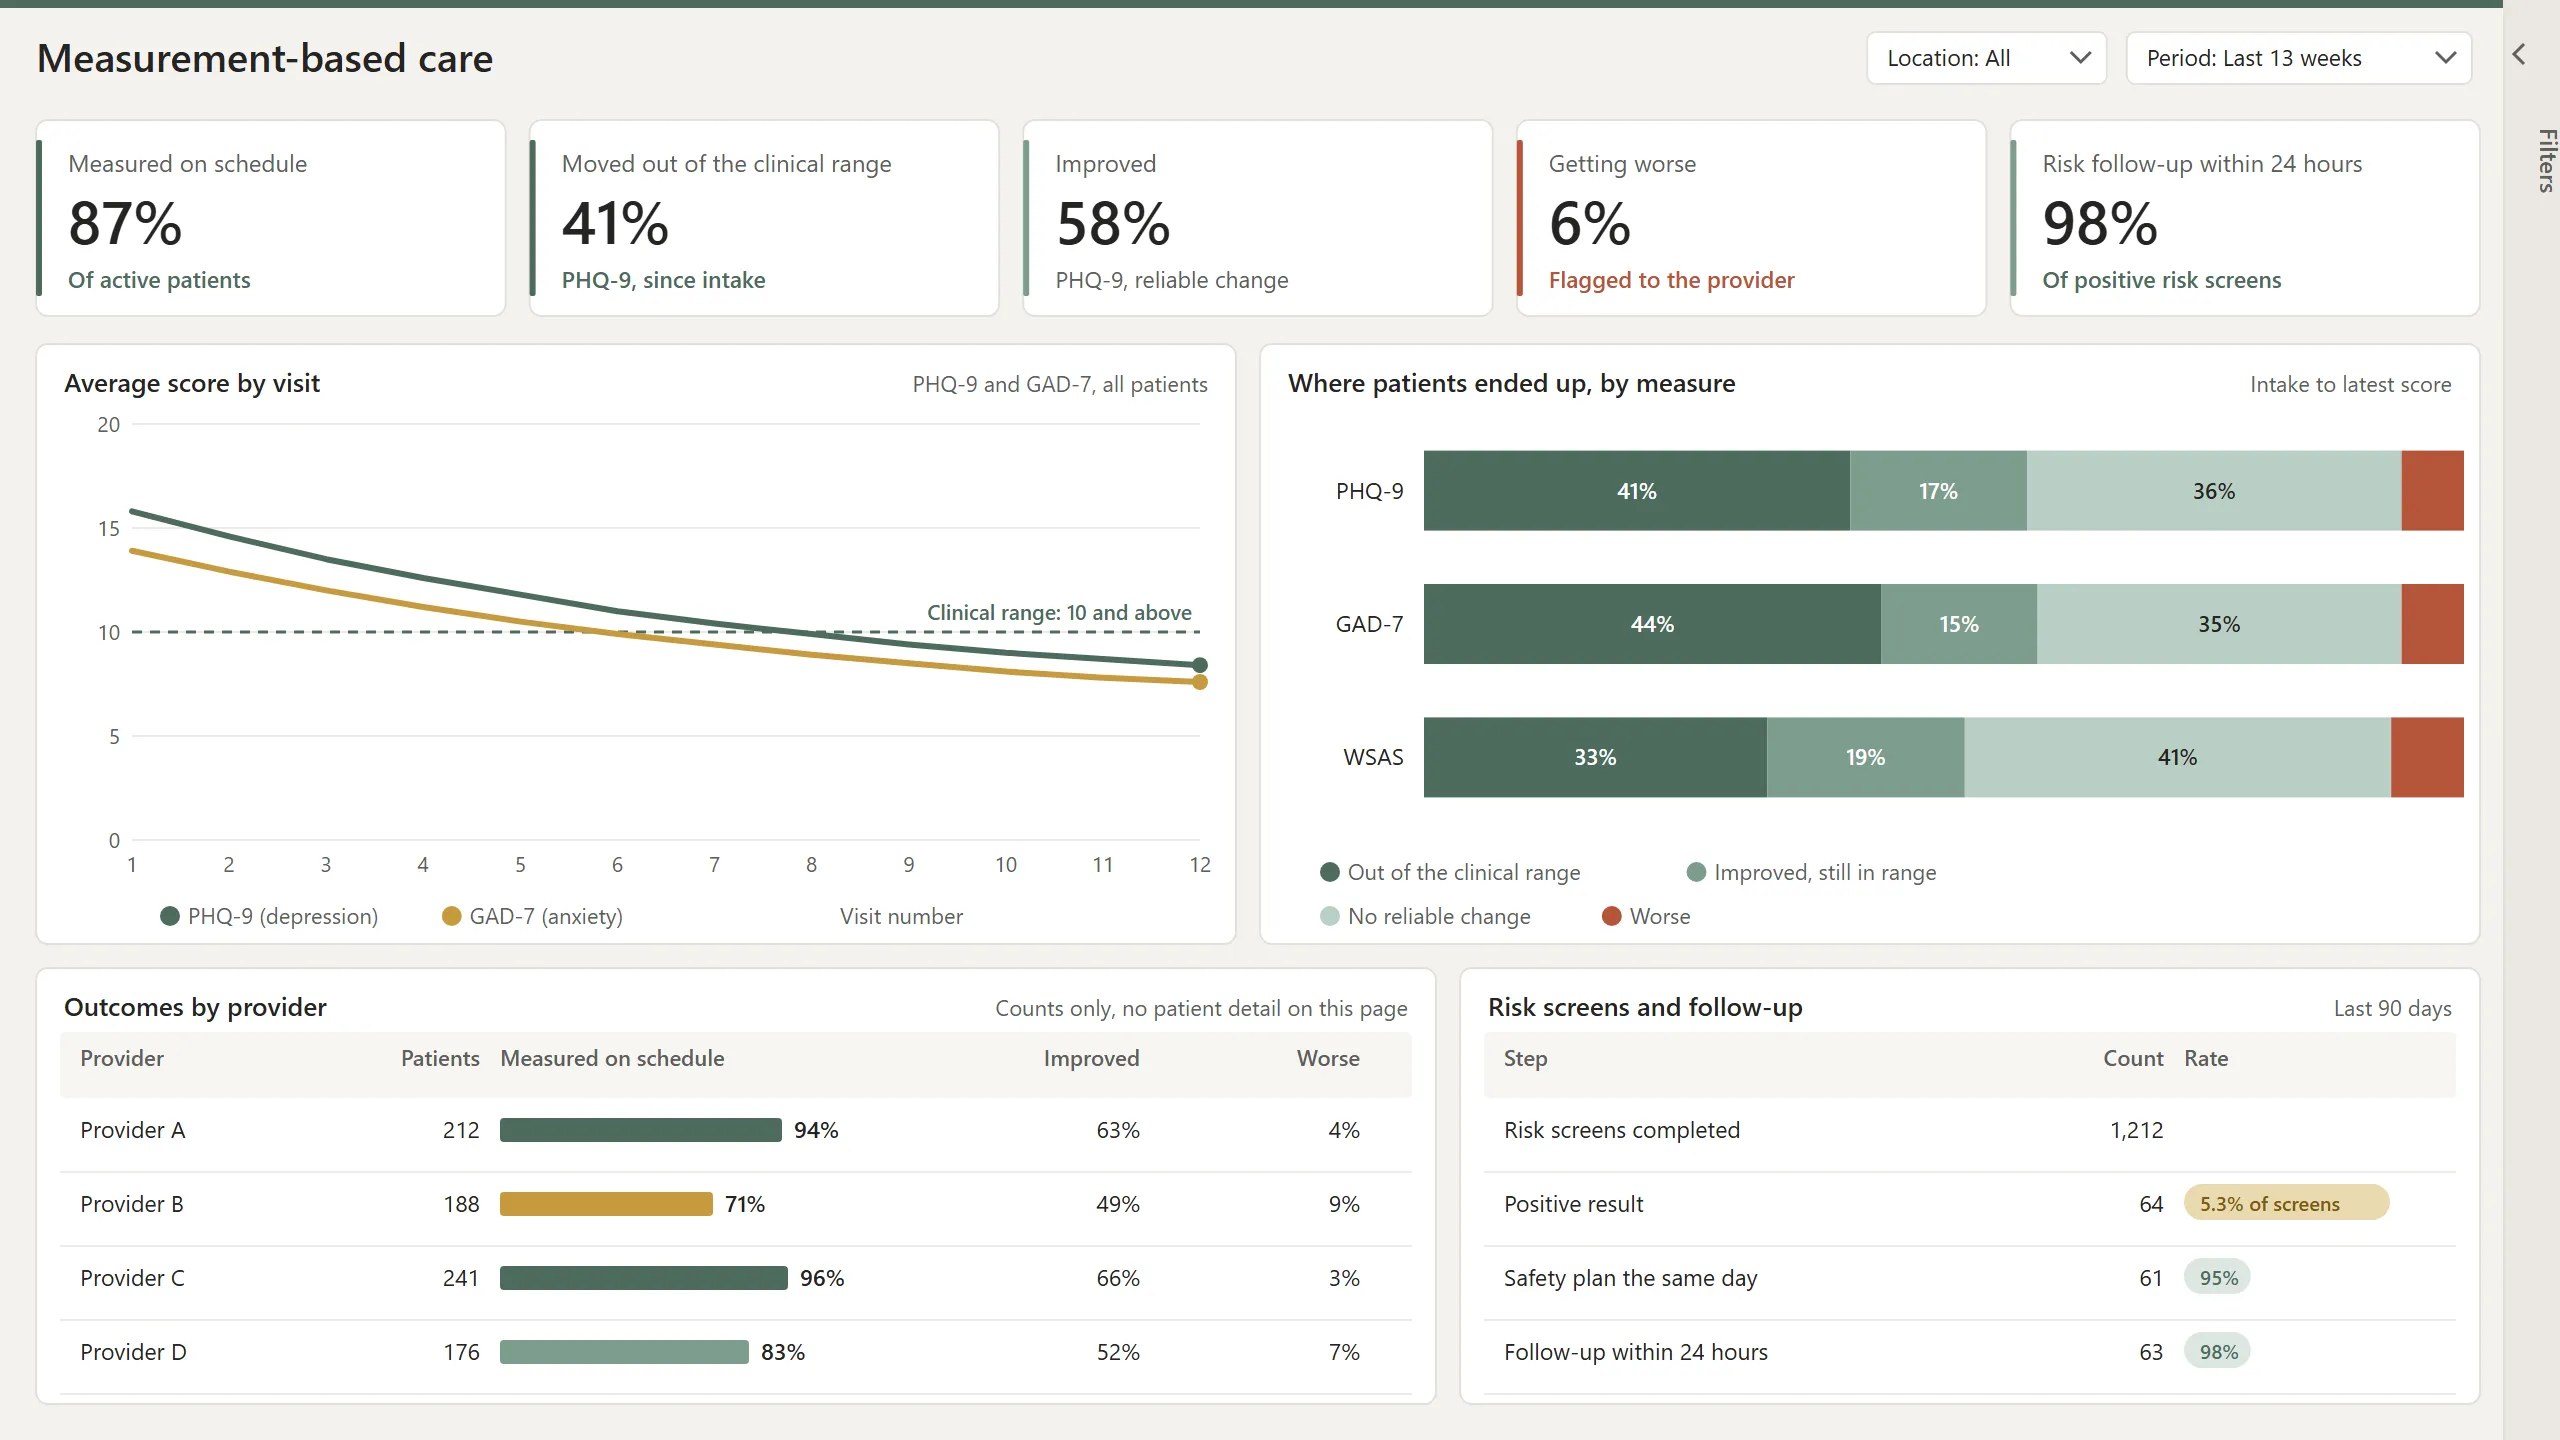
Scores from the measures your clinicians already give, tracked visit by visit and tied to the schedule and the claim. PHQ-9 (the depression questionnaire) and GAD-7 (the anxiety scale) by visit, against the clinical range. WSAS (the Work and Social Adjustment Scale) for how patients are doing at work, at home, and with other people. Who is improving, who is getting worse, and who moved out of the clinical range. Patients due for a measure who haven't had one. Change by provider, adjusted for case mix. Risk screens with a positive result, the same-day safety plan, and the follow-up within 24 hours. Outcomes next to visit frequency, so you can see whether patients who keep their care plan get better faster.
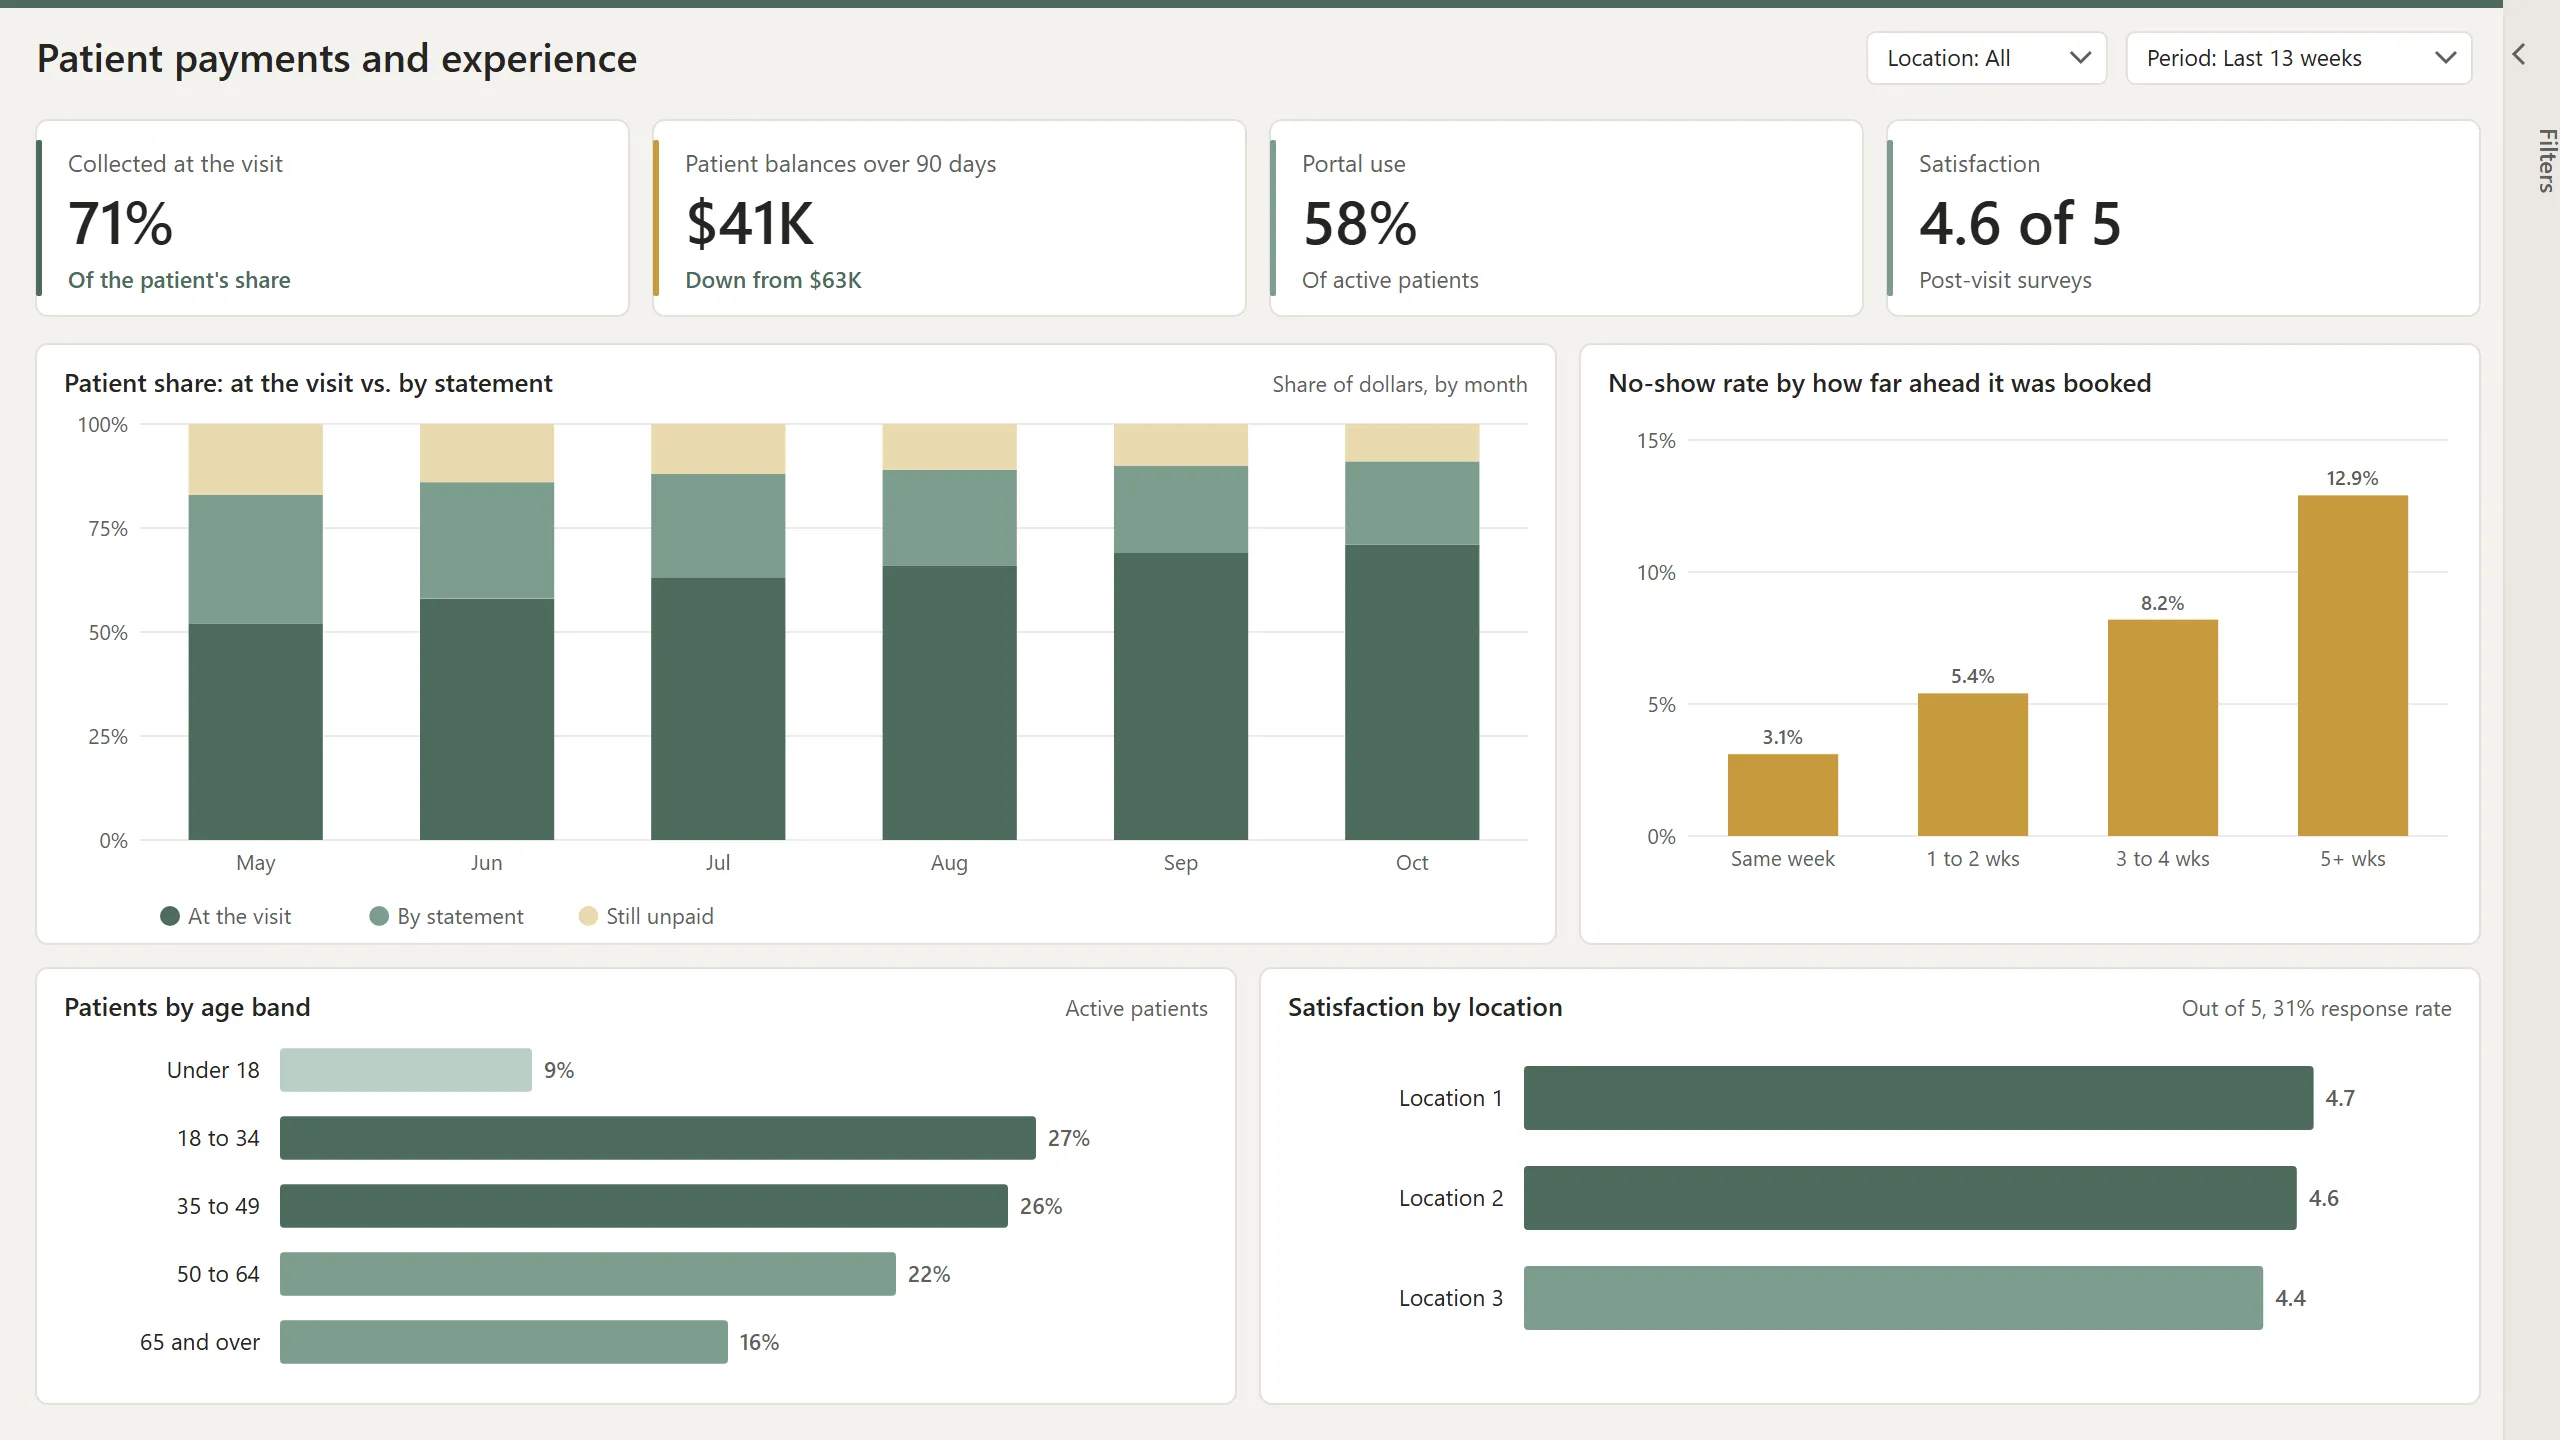
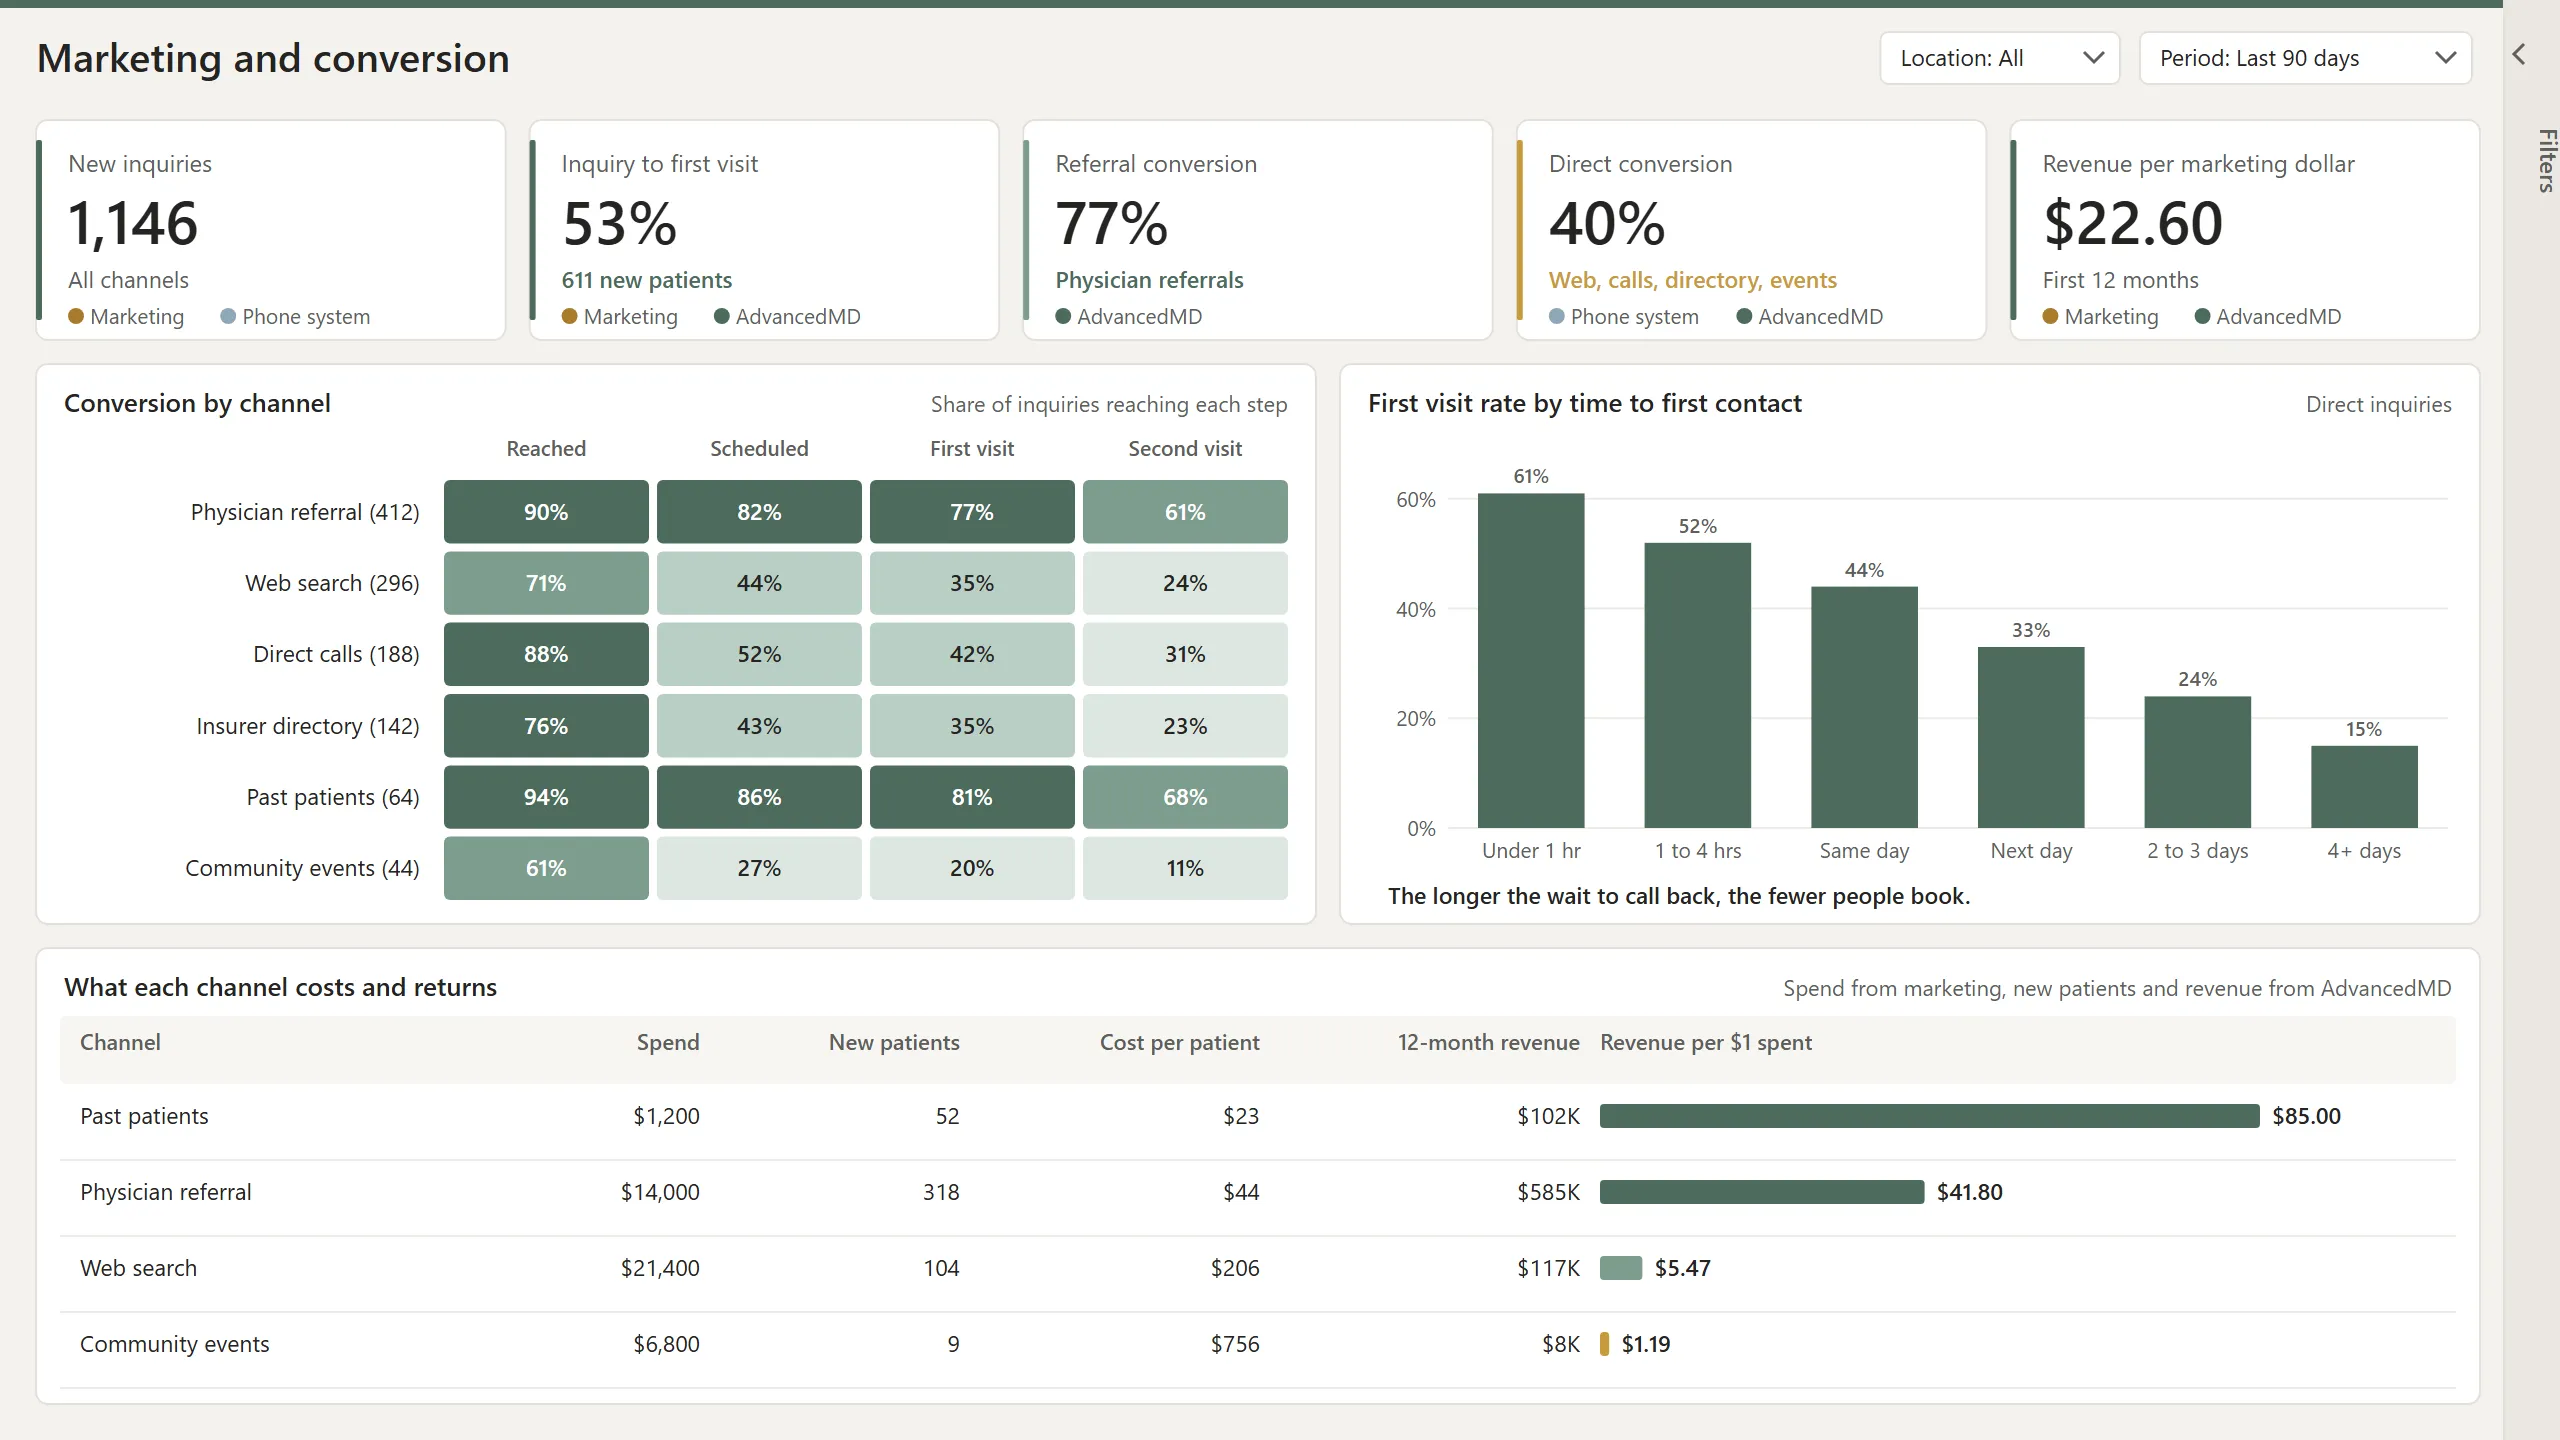
Patient acquisition, retention, and satisfaction. Patient engagement and follow-up rate. Patient payment and out-of-pocket tracking. Intake efficiency. Late-cancel and no-show management. Patient demographics. Patient feedback and satisfaction surveys. Visit history. Treatment-plan compliance. Inquiry to first visit conversion by channel. Time to first contact. Cost per new patient and revenue per marketing dollar.
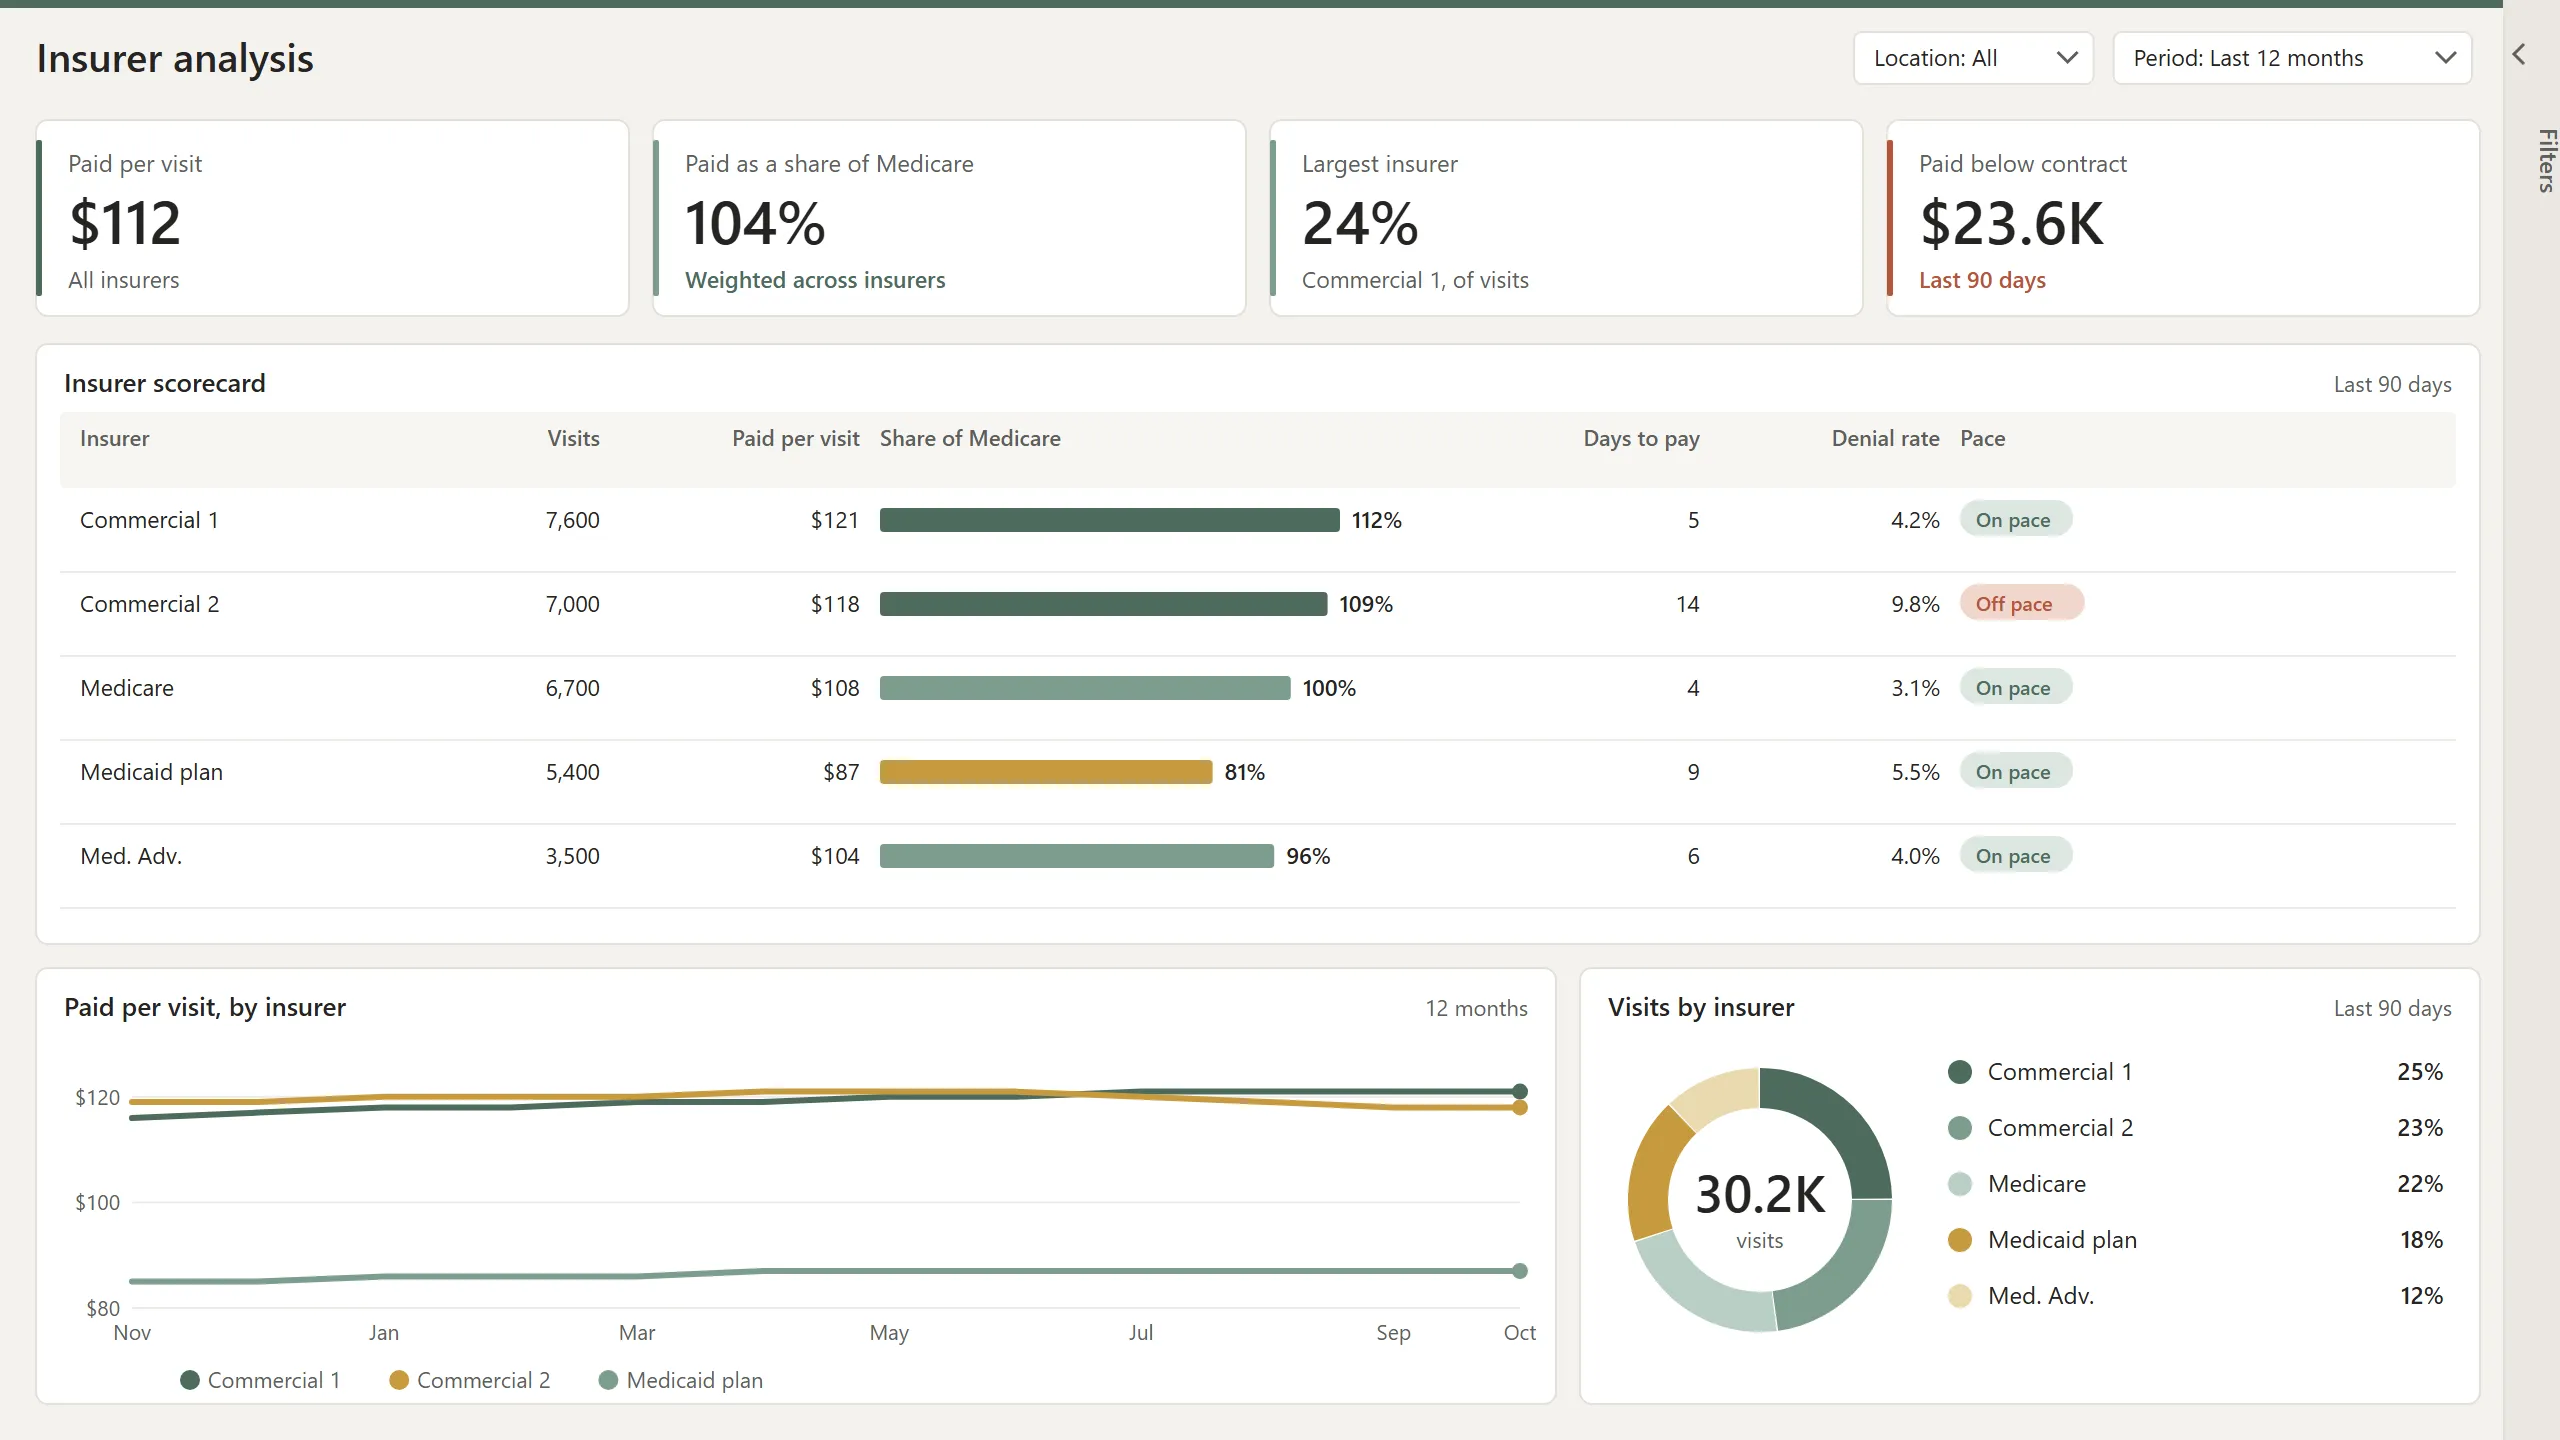
Top carrier and insurance analysis. Payer reimbursement metrics. CPT code analysis. Healthcare trend analysis. Patient risk stratification. Chronic disease management. Referral source and conversion analysis.
Payroll cost per provider next to production. Margin by location from your accounting system, after shared costs. Clearinghouse receipts and rejections, before anything posts. Card payments, declines, and expiring cards from your payment processor. Bank deposits matched to posted payments. Referral source revenue from your marketing tools. Reminder and confirmation results from patient messaging. Lab orders and results tied to the visit. Practices on another practice management system, side by side with AdvancedMD.
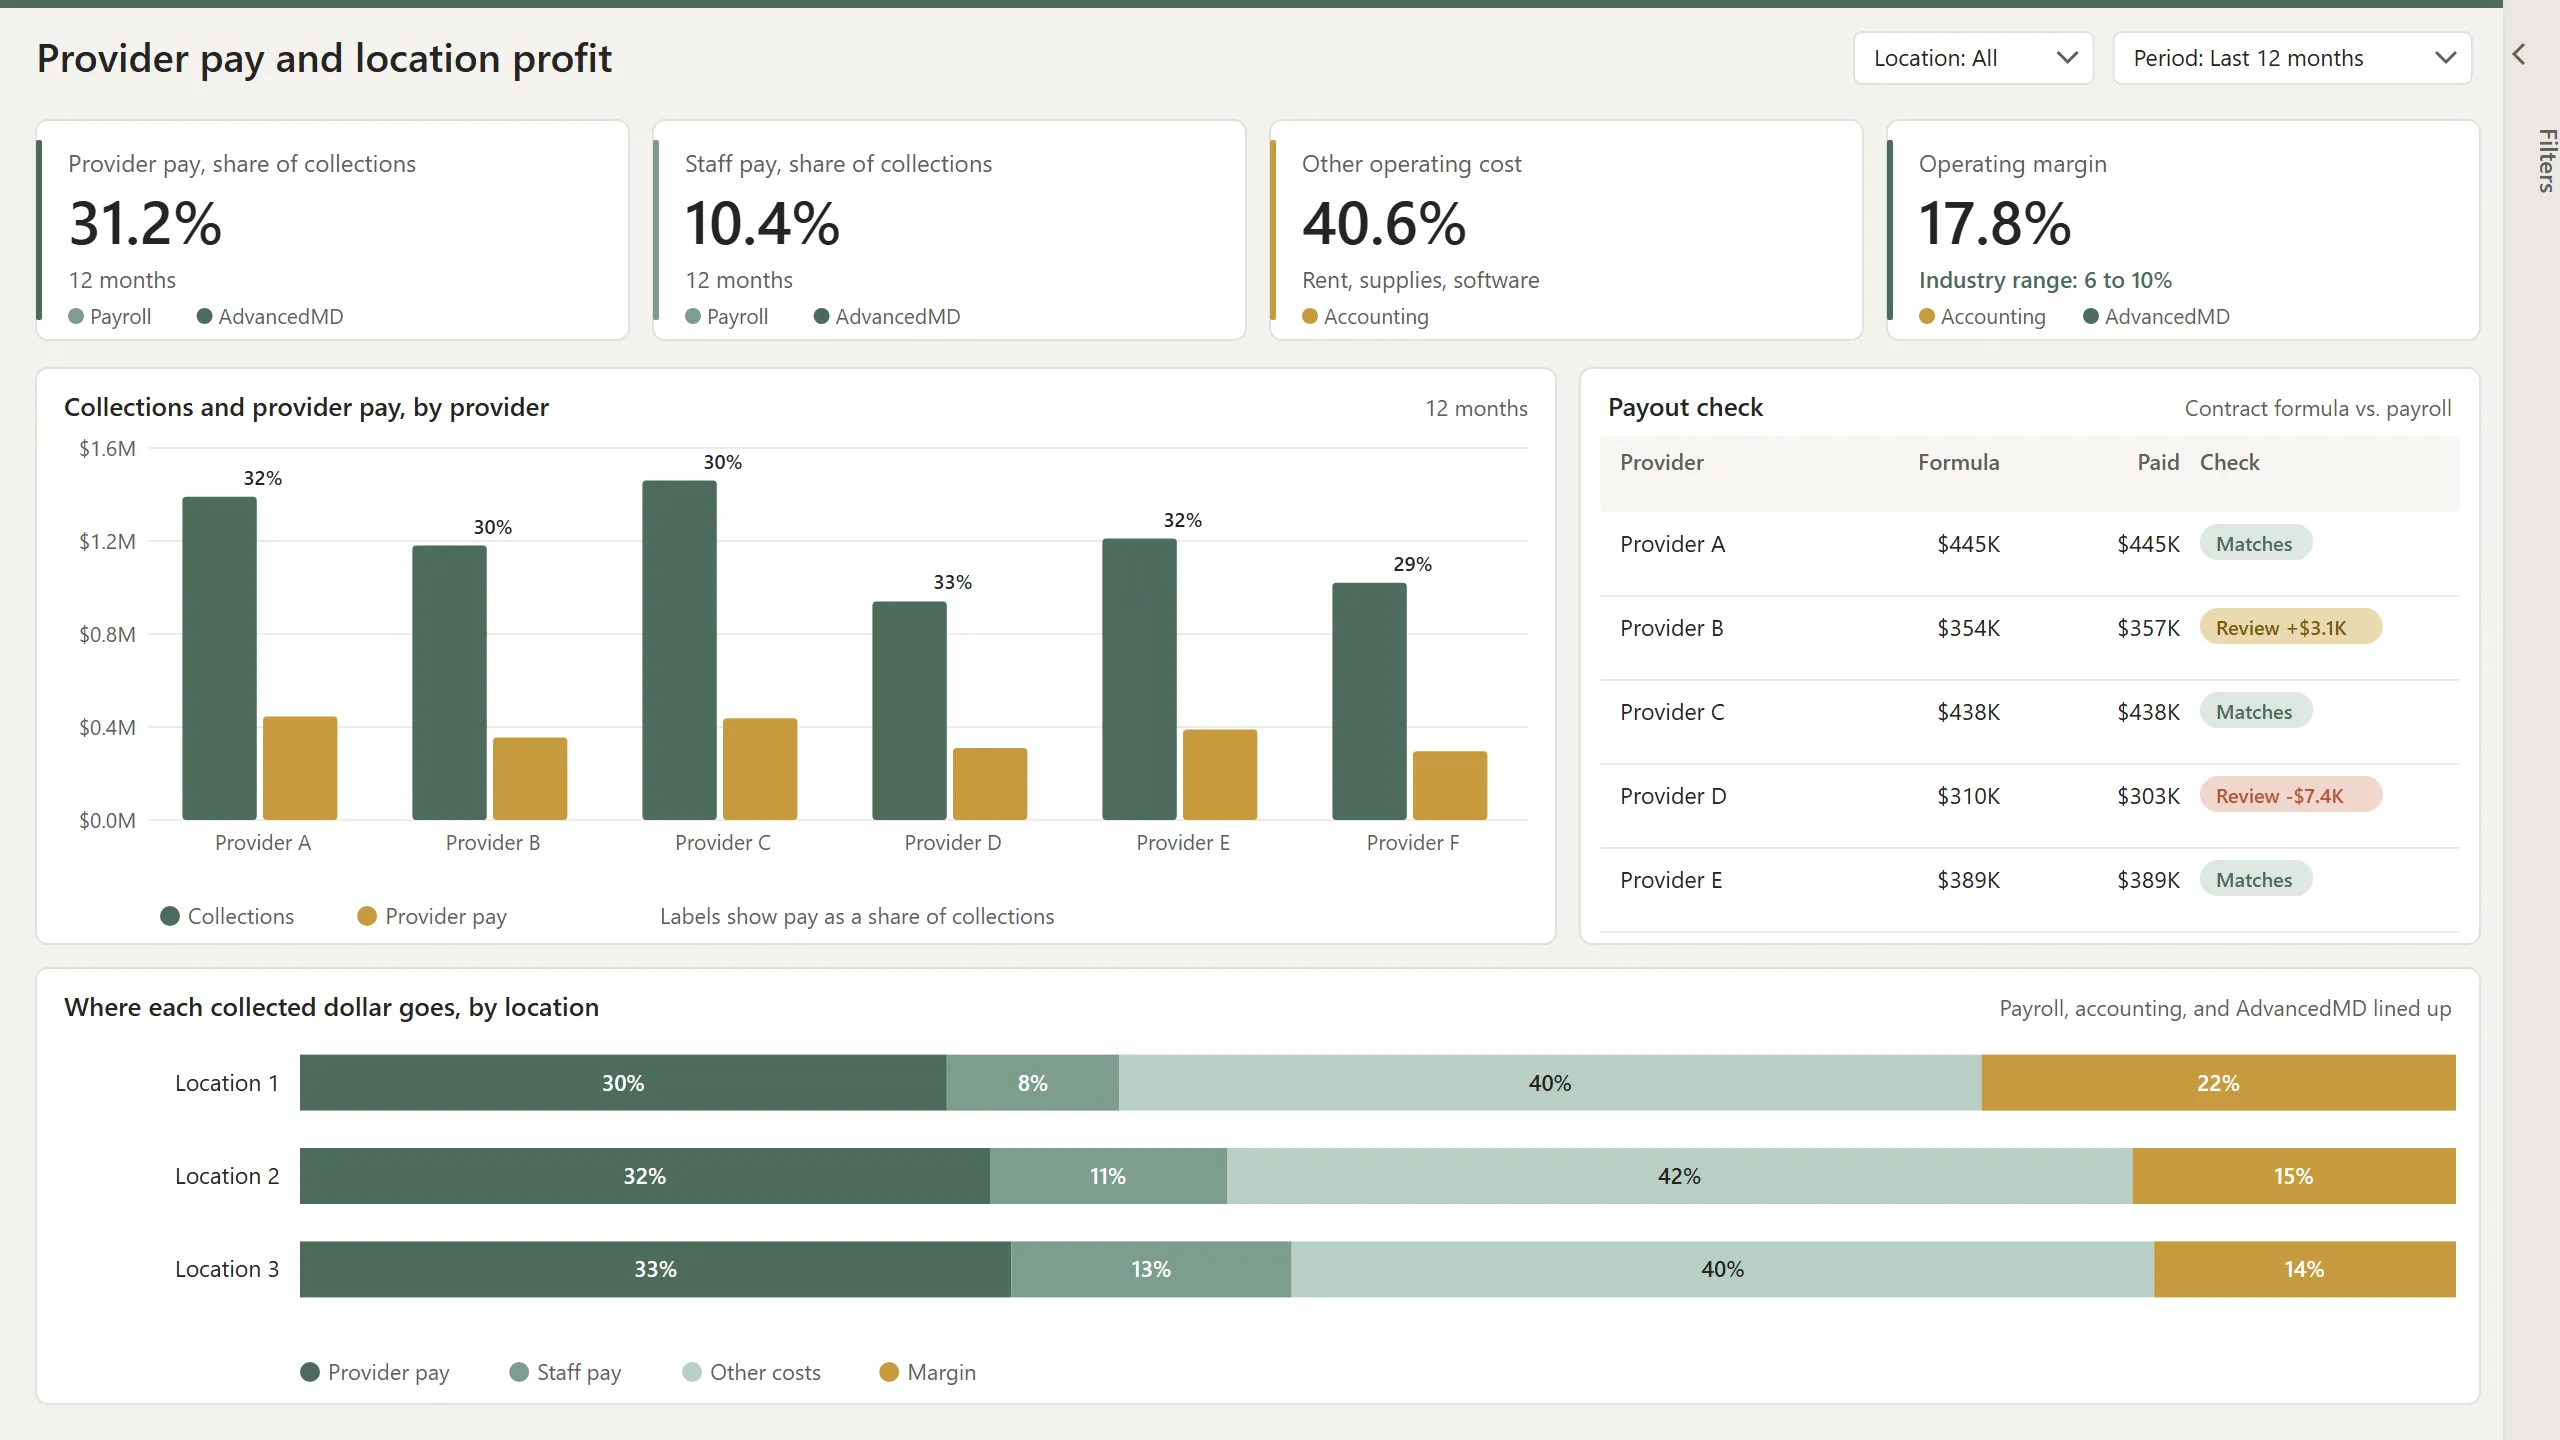
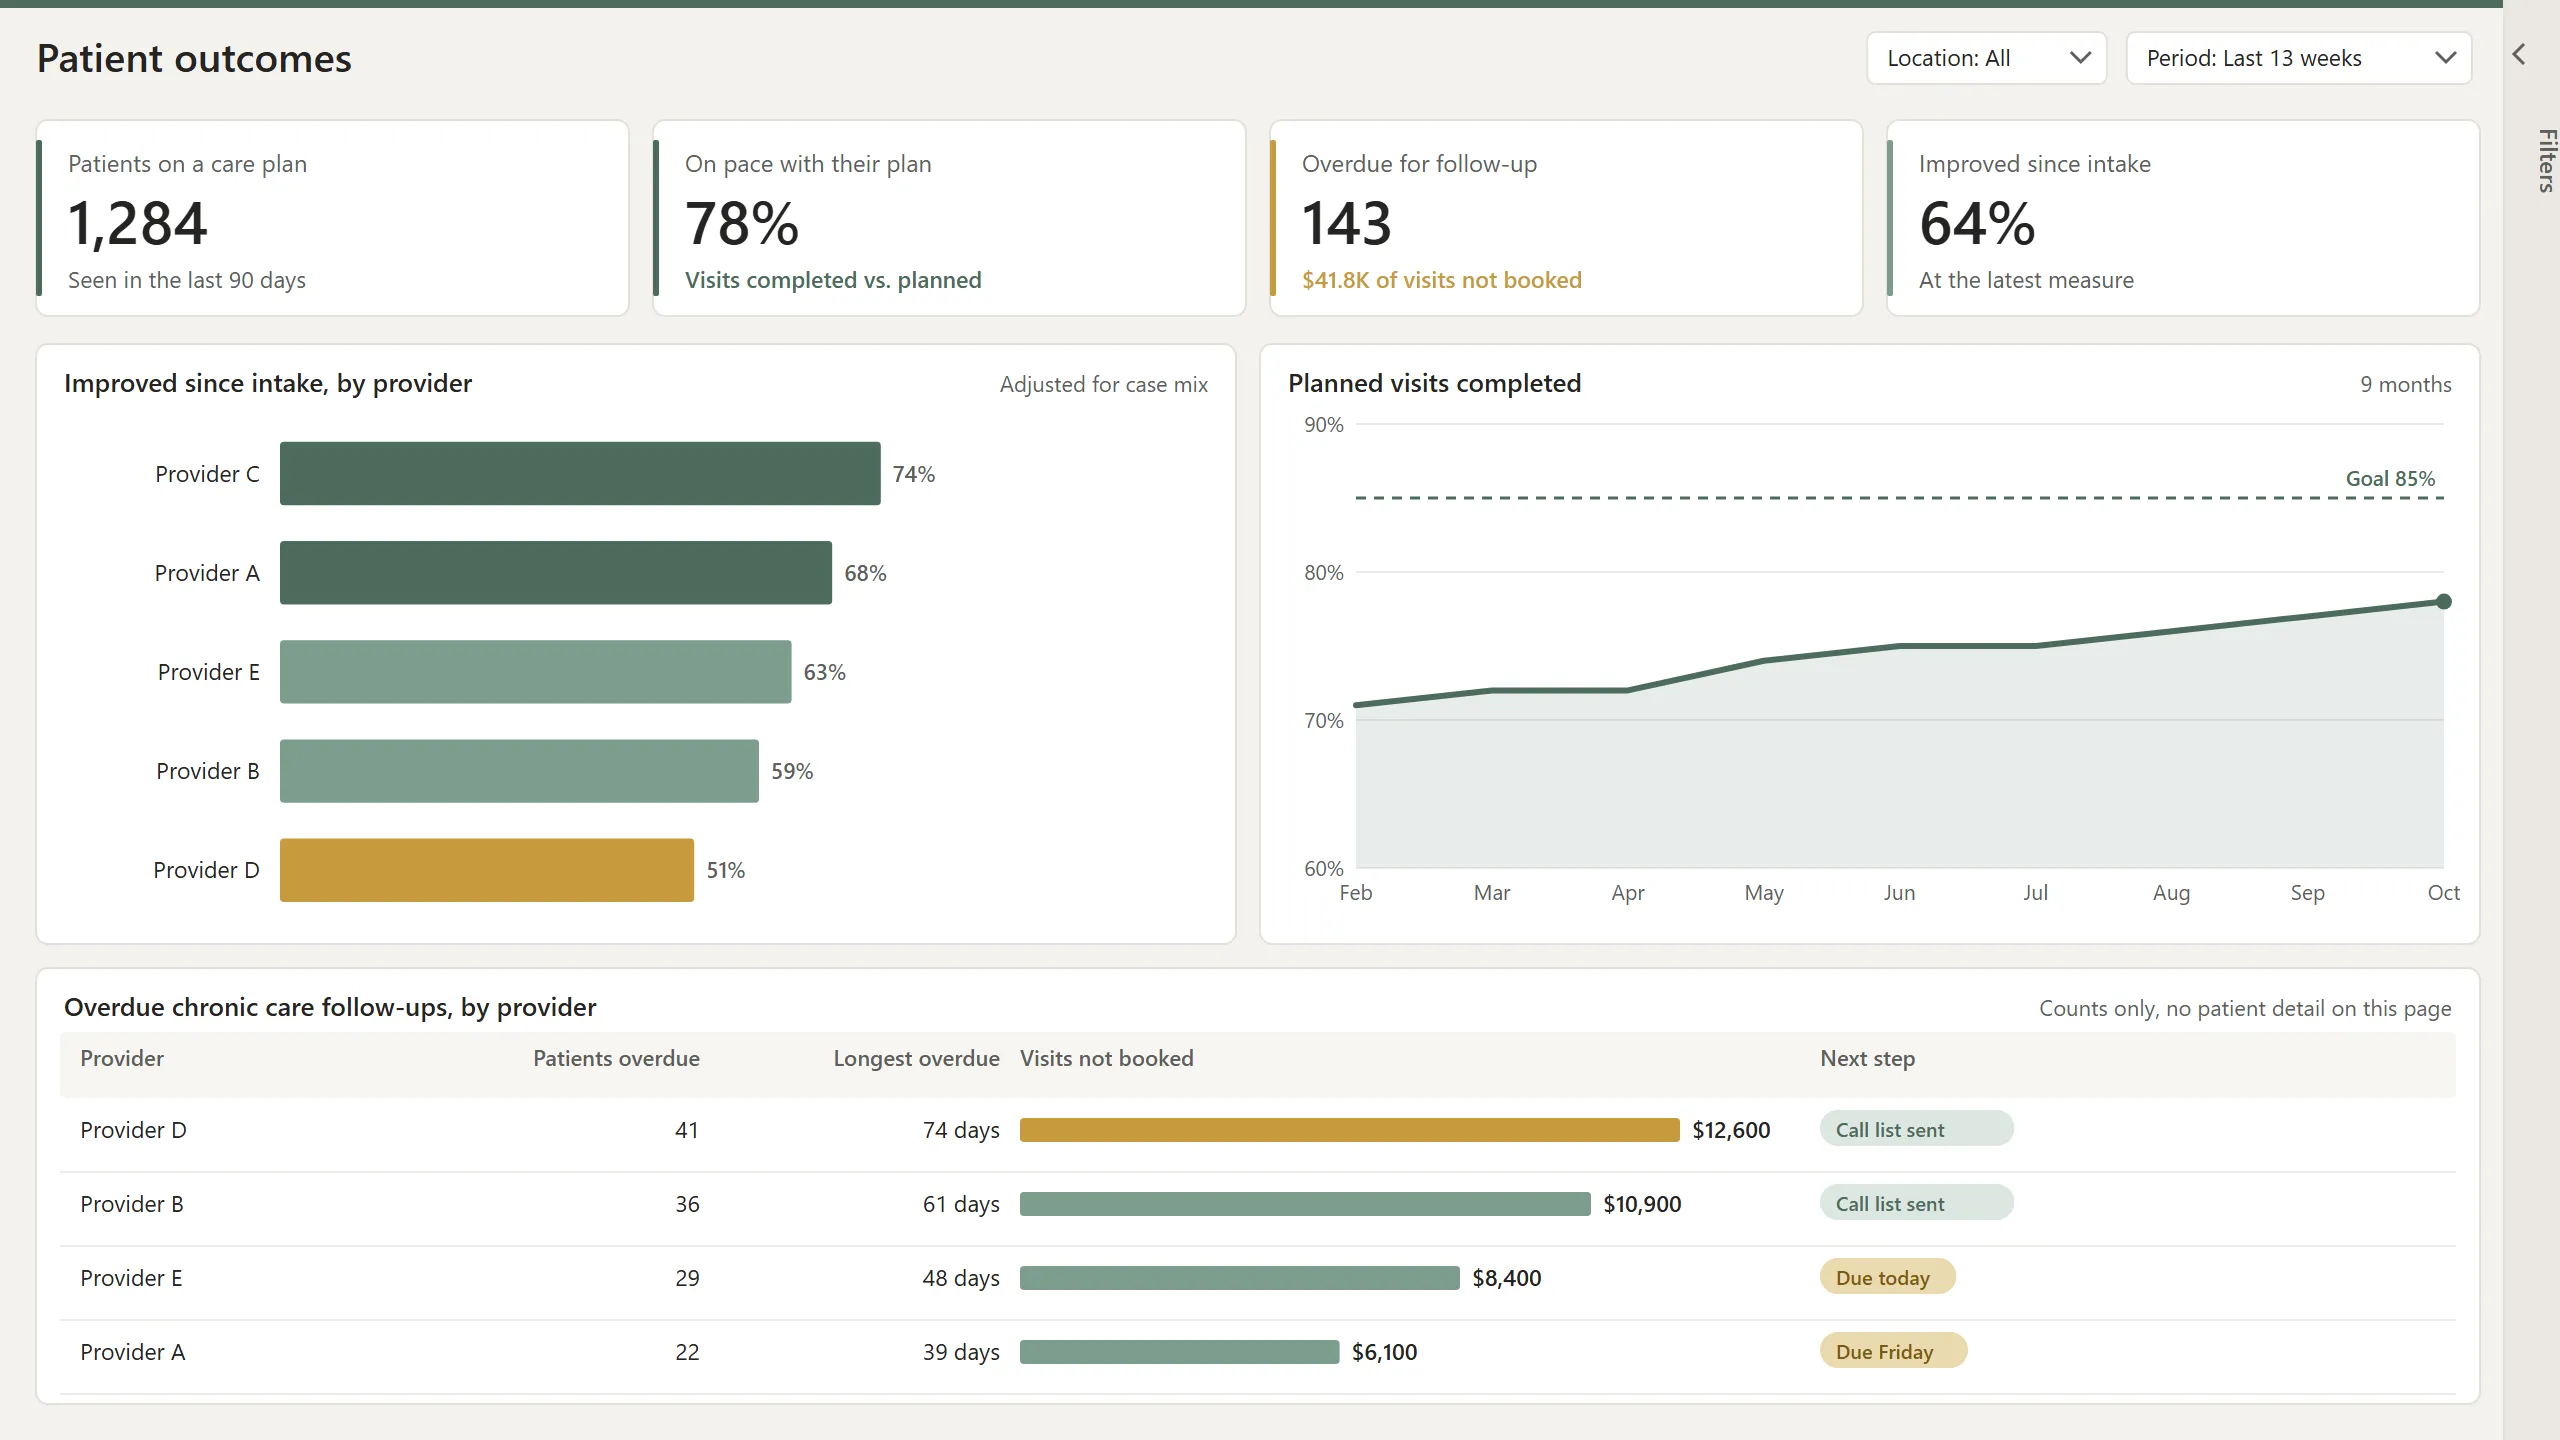
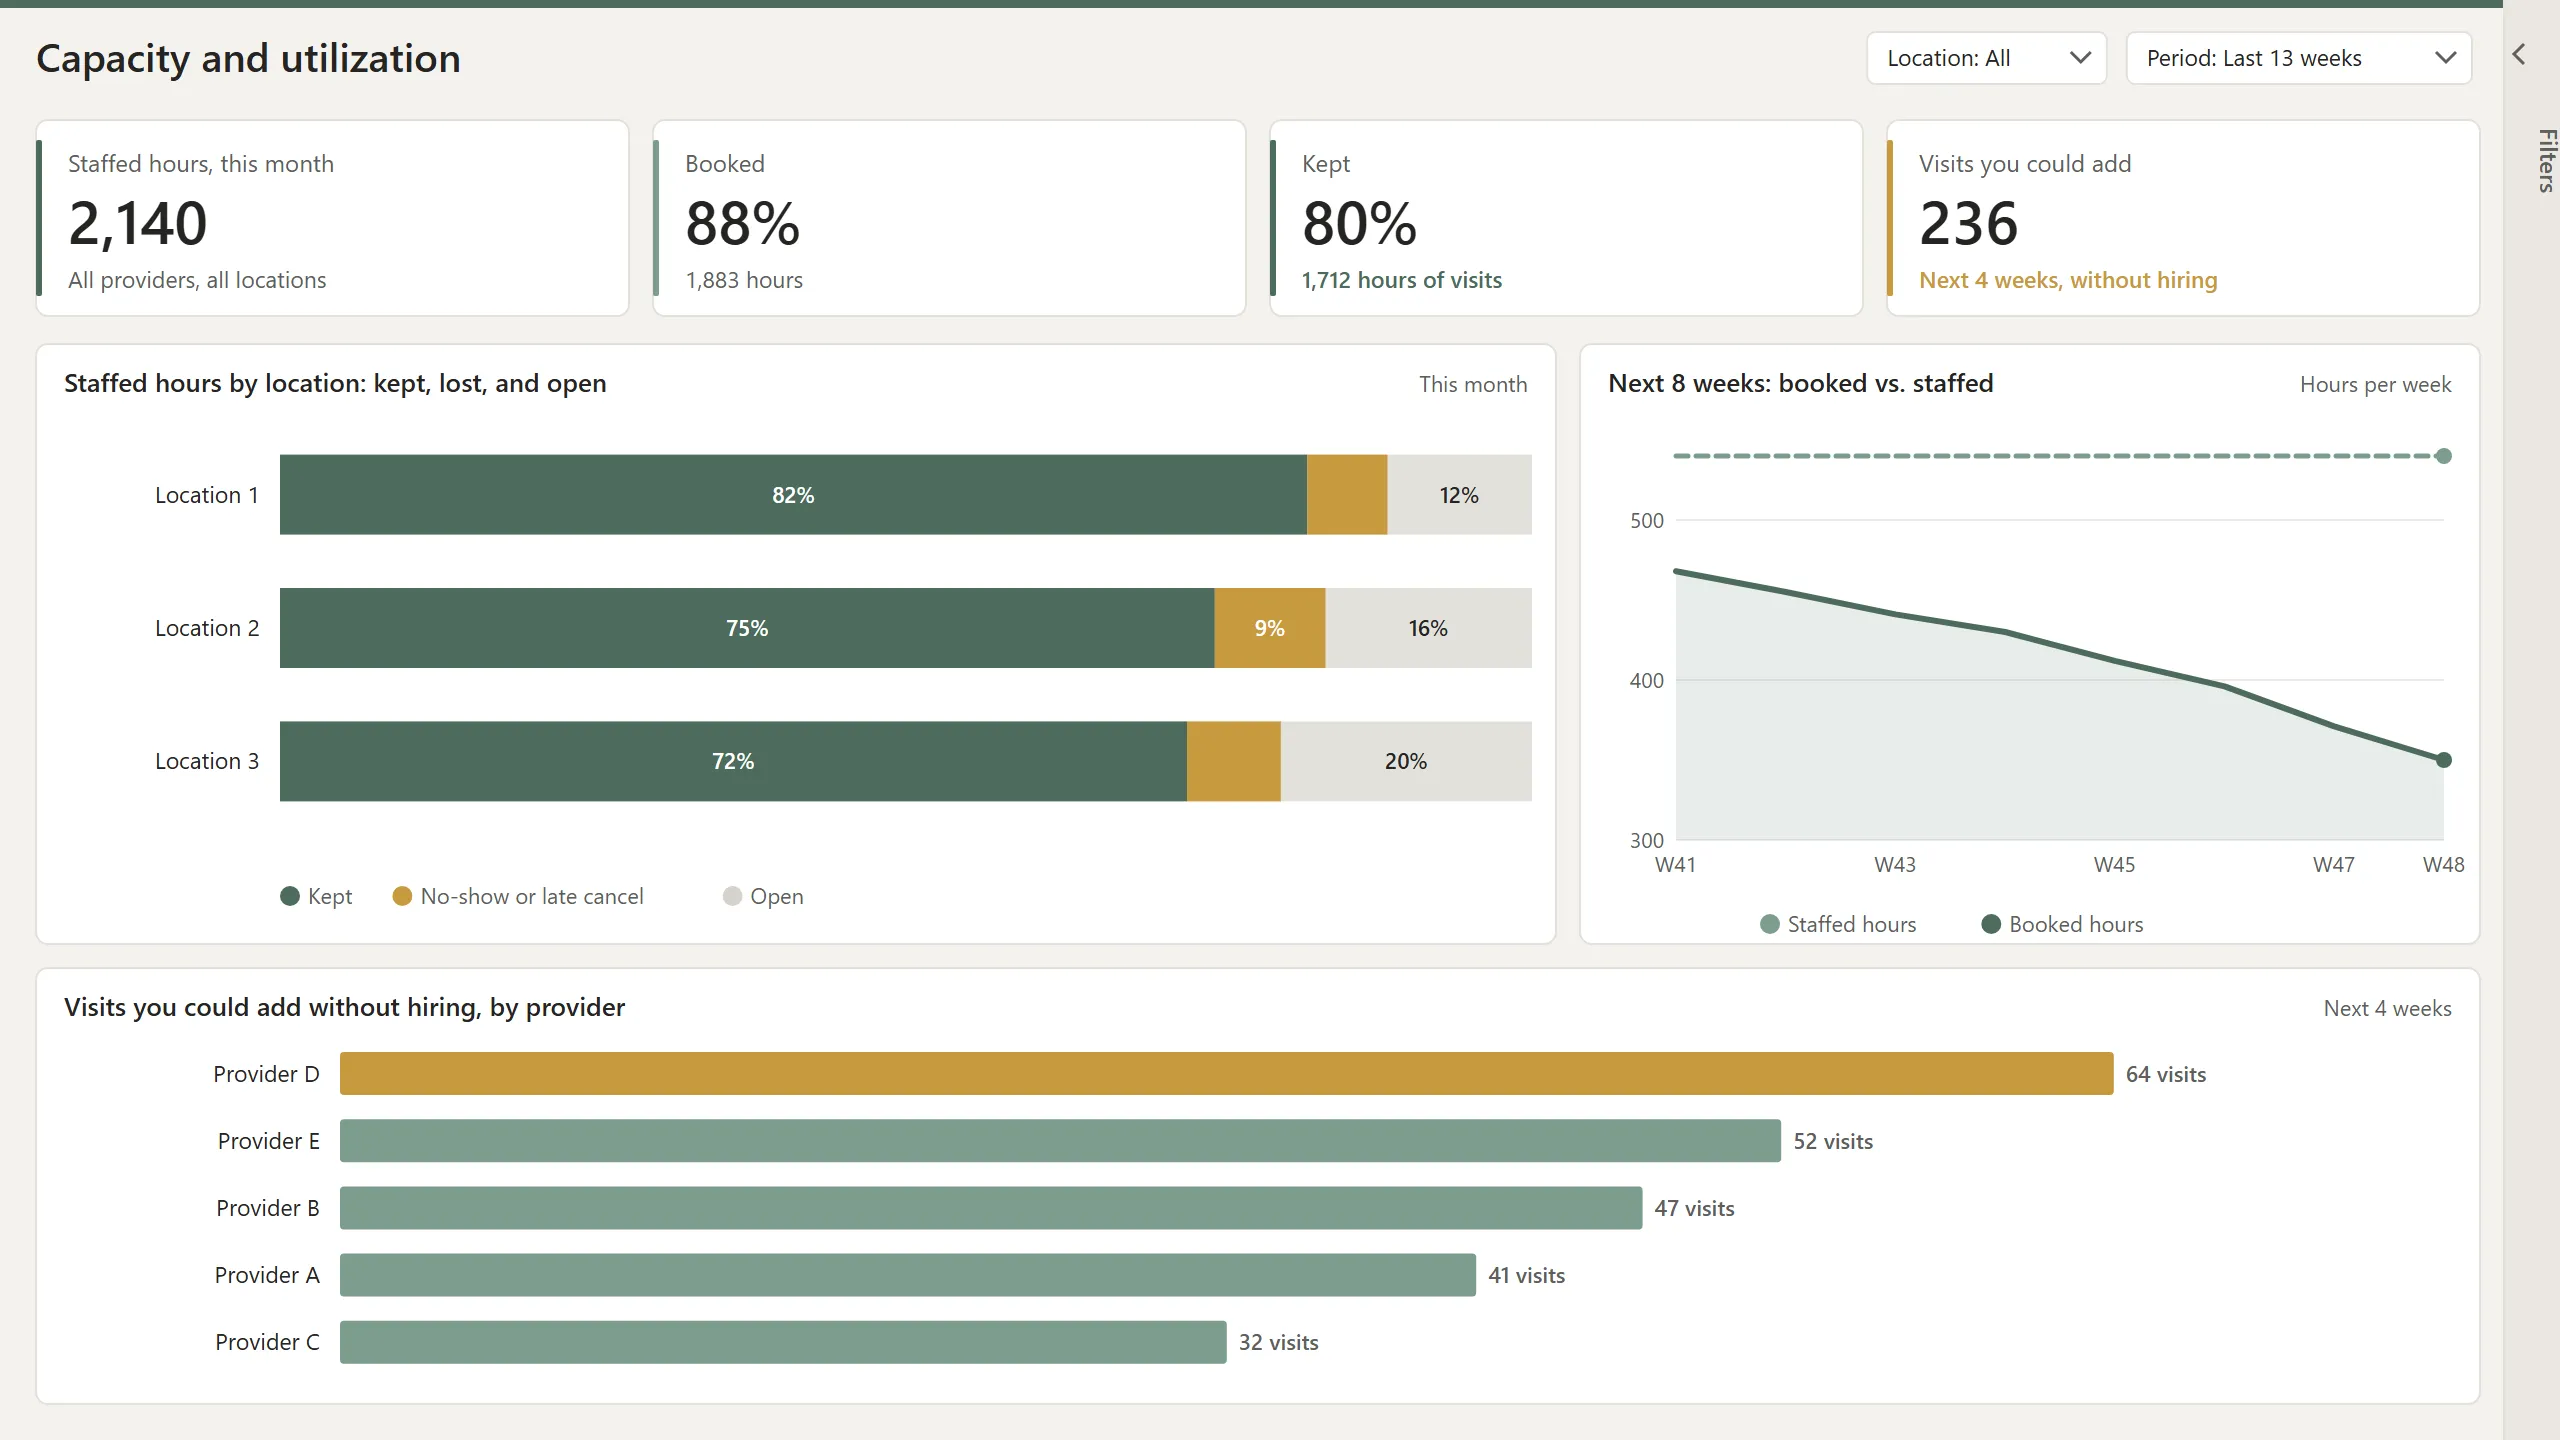
Patient outcomes, utilization, and capacity, in the same report as the money.
Money is where most reporting stops. The same report can follow what happens to patients and to the hours you already pay for, because a patient who stops coming is a care gap, an empty slot, and revenue that never arrives, all at once.
Patient outcomes
Are patients coming as often as their care plan says? Which chronic care patients are overdue, and what are those visits worth? Do outcomes differ by provider once case mix is counted, using the measures your clinicians already record?
Utilization
How much of each provider's schedule turned into kept visits, by weekday, location, and visit type, and where the no-shows and late cancels cluster.
Capacity
How many more visits the practice can take without hiring, where the open hours sit, and what the next eight weeks look like against the hours you staff.
AdvancedMD at the center, with the systems around it in the same report.
AdvancedMD records the visit, the charge, the claim, and the payment. The rest of the answer usually sits next door. We connect AdvancedMD, through the ODBC and API access it provides, with the systems around it. Then we line everything up on the same patients, providers, locations, and dates, and keep each connection working when either side changes.
- Payroll
- What each provider and staff role costs, next to what they produce
- Accounting
- Expenses and margin, so revenue becomes profit by location
- Clearinghouse
- Claim receipts, rejections, and payment reports before anything posts
- Payment processor
- Card payments, declines, and cards about to expire
- Bank
- Deposits matched to the payments recorded in AdvancedMD
- Marketing and referrals
- Where each patient came from, and what they were worth a year later
- Patient messaging
- Who was reminded, who confirmed, and who never answered
- Labs
- Orders sent and results back, tied to the visit that ordered them
- Other PM or EHR systems
- Practices you acquired, side by side with AdvancedMD
AdvancedMD stays the system of record. Nothing moves out of it, and your team keeps working the way it does today. The reports simply see more of the practice at once.
A finding isn't the end. It resolves into a move.
This is the part no dashboard does. A dashboard hands you a chart and leaves the rest to you. We take every finding to the move that actually changes it, and there are three kinds.
Create a behavior
A new human step, built into the workflow so it happens by default, like booking the next appointment before the patient leaves the visit, so retention stops leaking at the source.
Take an action
The next best move, handed to the specific person who owns it, ranked by what it's worth, so effort goes to the dollars that matter instead of an aging report to sort through.
Automate it away
The task that should never have needed a person, removed entirely, so the problem can't come back the next time someone forgets.
Find it, then create the behavior, take the action, or automate it away. That's the difference between a report and an outcome.
Underneath all three, the measurement stays on. If the clock starts creeping in the wrong direction, you see it while it's still a few days of drift rather than a quarter of surprise.
Real data infrastructure, not a spreadsheet that breaks
This runs on the same data infrastructure enterprises use. We build on Microsoft SQL and Azure SQL, with Power BI and Microsoft Fabric delivering the reports and portals your team logs into. It grows with you, from a single practice to a multi-location group, without starting over.
And it's secured to how your organization is actually structured. Row-level security means each person sees only what they should: a provider sees their own numbers, a location manager sees their location, an owner sees everything. Your data stays governed, access stays controlled, and the reports your team opens are the ones they're allowed to see, down to the row.
The layer that gets more out of the system you own
AdvancedMD runs your practice and records the data. We surface what the standard reports were never built to show, using the ODBC and API access AdvancedMD provides for exactly this. Think of us as the layer that gets more out of the system you already own. AdvancedMD keeps doing its job. We do the one nobody else is doing.
When AdvancedMD's own reports are enough
If you haven't really worked Report Center, start there. It's included, AdvancedMD's website lists about 650 reports in it, and a lot of what gets called a visibility problem is a report nobody has opened.
If your question is about trends, buy the add-on. It costs less than any outside help and it does that job well.
Bring us one question your reports have never answered. If it lands in Report Center or the add-on, we point you at the report and we're done.
If both of those are already true, the question is still open, and you plan to change how the practice runs rather than just find out what's wrong with it, that gap is exactly what we close.
What to look at, how often, and who it goes to.
A report earns its place by changing what somebody does before the next one arrives. A quarterly review guarantees that anything it finds has been running for months. This is the rhythm that keeps problems small, built on the ten numbers an owner should watch and the weekly report a billing team should send.
Every day
Short worklists, each to the person who can act: notes waiting on a signature to the provider, claims built and not sent to the biller, tomorrow's patients with a coverage problem to the front desk, and payments received but not yet recorded to whoever posts them.
Every week
Five numbers for the owner: work that can't bill yet, claims sent against visits delivered, denials as a short list with a name on every line, cash expected against cash that arrived, and patient balances by age.
Every month
The trend view: the share of claims paid the first time they're sent, days from the visit to cash, no-shows and rebooking, revenue per clinician day, and any number that moved without anyone knowing why.
Every quarter
The structural view: each insurance company against its own past pace, payments against your contracted rates, what each location and service line earns after shared costs, referral sources by revenue, and your AR read the way a lender or buyer would read it.
AdvancedMD Report Center vs. Reporting and Analytics vs. Power BI.
Each one does a different job. Start with the left column, because the reports you already own are the cheapest answer, and move right only when the question needs it.
| Report Center | Reporting and Analytics | Power BI, built by PracticePath | |
|---|---|---|---|
| What it costs | Included with AdvancedMD's billing software | A paid AdvancedMD add-on | Microsoft Power BI licenses, plus the work of building it |
| Best at | One question, one date range, inside AdvancedMD | Trends and comparisons on AdvancedMD's own numbers | Questions that need more than one system, or the full history |
| Trends over time | Run the report again for each period | Built in | Any number, over any stretch, by insurer, provider, or location |
| Payroll, accounting, referral sources | AdvancedMD data | AdvancedMD data | Side by side with your AdvancedMD data |
| History | As far back as each report reaches | As far back as the add-on reaches | As long as you keep your own copy |
| Who sees what | Set inside AdvancedMD | Set inside AdvancedMD | Row-level security, down to the row |
| Where you look | Inside AdvancedMD | Inside AdvancedMD | A browser, or the Power BI phone app |
| Who builds it | You pick and run reports | You set up the views | We build it and keep it working |
AdvancedMD reporting terms, in everyday words.
- Report Center
- AdvancedMD's built-in library of reports, included with the billing software.
- Reporting and Analytics
- AdvancedMD's paid add-on for trends and comparisons. It used to be called AdvancedInsight.
- Office key
- The number that identifies one AdvancedMD account. A group of practices can run more than one.
- ODBC
- A read-only connection AdvancedMD provides, so your own data can be read outside the report screen.
- Open API
- AdvancedMD's connection for passing information to and from other systems as it happens.
- Power BI
- Microsoft's reporting service. Reports open in a browser or in the Power BI phone app.
- Microsoft Fabric
- Microsoft's analytics service that brings data storage, data preparation, and Power BI together.
- Row-level security
- Rules inside a shared report that decide which rows each person is allowed to see.
- Days in AR
- How long billed claims take to pay, counted from the day the claim goes out.
- Cash conversion
- The days from the visit to money in the bank, counted from the visit itself.
- Clean claim rate
- The share of claims an insurance company pays the first time they're sent.
- Denial
- The insurance company's refusal to pay a claim, sent with a reason code.
- Payment report (ERA)
- The electronic explanation an insurance company sends with a payment, line by line.
- Posting
- Recording an insurance payment or denial against the visit in your billing system.
- Aging report
- A list of unpaid balances, sorted by how long each one has been open.
- Contract discount
- The part of your full fee your insurance contract says is never paid. Billing teams call it a contractual adjustment.
- Underpayment
- A payment below what your contract with that insurance company says the service should pay.
- wRVU
- Work relative value unit, the standard measure of how much work a visit took.
- Utilization
- The share of the hours you staff that turned into kept visits.
- Capacity
- The visits you could still add with the people and hours you already have.
- Measurement-based care
- Giving patients the same short questionnaires at regular visits and using the scores to guide treatment.
- PHQ-9 and GAD-7
- Short, widely used questionnaires that score depression (PHQ-9) and anxiety (GAD-7).
- WSAS
- The Work and Social Adjustment Scale, a short questionnaire on how symptoms affect work, home, and social life.
- Revenue oversight
- The daily job of watching every visit from the booked appointment to money in the bank.
AdvancedMD reporting and Power BI, in 64 answers.
What AdvancedMD includes, what Power BI adds, how the two connect, who sees what, and what it costs.
AdvancedMD's own reportingHow many reports does AdvancedMD include?
AdvancedMD's website says Report Center has more than 150 standard financial reports and nearly 500 configurable ones, about 650 in all, included with the billing software. You shape the configurable ones with your own date ranges and filters. That's a lot of reporting you already own, so it's the first place to look before buying anything.
Is Reporting and Analytics included or extra?
Extra. Standard reporting through Report Center comes with every AdvancedMD practice management subscription. Reporting and Analytics, the trending tier, is bought separately. It compares months, tracks how insurer payments are moving, flags providers running outside the pattern, and exports to Excel. If your questions are about trends, it's the cheaper answer.
What happened to AdvancedInsight?
AdvancedMD refreshed the product and renamed it Reporting and Analytics. Older articles and videos still use the old name, which is why the two can look like separate products. They're the same paid add-on: the trending and comparison tier that sits on top of the reports included with the billing software.
Can I build custom reports in AdvancedMD?
Yes, within Report Center. AdvancedMD's website says nearly 500 of its reports are configurable, and the report generator lets you set your own parameters, such as date range, provider, insurer, and location, before you run them. What a custom report can't do is pull in information that lives outside AdvancedMD, like payroll or accounting. That takes the tools for large practices.
Can I export AdvancedMD reports to Excel?
Yes. AdvancedMD lets you download Report Center reports to Excel, and the paid Reporting and Analytics add-on exports to Excel too. Excel works well for a one-time look. It gets fragile when the same report has to be rebuilt by hand every month, which is usually the point where a practice moves the work into Power BI.
Why do two AdvancedMD reports for the same month disagree?
Because the same visit lives in more than one record. A visit, a charge, and a claim each carry their own date, and one report may count by visit date while another counts by posting date. Adjustments, write-offs, and refunds are separate kinds of transaction too. Both reports can be correct, because they're answering slightly different questions.
I am still deciding on AdvancedMD. Is the reporting any good?
Report Center is deep for what it is: AdvancedMD's website lists about 650 reports, included at no extra charge. The trending tier costs more and does trends well. Anything that needs two systems looked at together, such as AdvancedMD next to payroll or accounting, is a separate piece of work no practice management system does for you.
What does the AdvancedMD dashboard show?
AdvancedMD's website describes an at-a-glance dashboard of your financial health that you can filter by provider, insurer, location, and timeframe. It's built for a quick daily look. When a number on it moves, the next question is which claims moved it, and that's where a Power BI report that drills from the number down to the claims behind it picks up.
How do I see a six-month trend without running the same report six times?
Two ways. The Reporting and Analytics add-on trends and compares months inside AdvancedMD, and for trends on AdvancedMD's own numbers it's the cheaper answer. A Power BI report keeps every day's history in one place, so any number can be trended over any stretch, by insurer, provider, or location, without rerunning reports and stitching exports together in Excel.
Can I get AdvancedMD data into Power BI?
Yes, and it's a common place to put it. AdvancedMD provides ODBC and an open API for practices that want their data to go further than the standard reports. What matters more than the tool is which question the report is meant to settle. A fast dashboard answering the wrong question costs more than no dashboard.
How does Power BI connect to AdvancedMD?
Through the access AdvancedMD provides for exactly this: ODBC, a read-only connection to your own data, and an open API for live connections between systems. AdvancedMD lists both under its tools for enterprise and group practices. We handle the connection and keep it working when either side changes, so your team never has to manage it.
Do I need AdvancedMD's tools for large practices to use Power BI?
For anything beyond pasting exported reports into Power BI, yes. The direct access is a paid AdvancedMD add-on, and the line item is small compared to what it opens up. Exported reports can feed a simple Power BI view, but someone has to pull them by hand, and they only hold what the report already shows.
Does it work with or without the Reporting and Analytics add-on?
Yes, either way. The Power BI work reads from the access AdvancedMD provides for your data, not from the add-on. Practices that already pay for the add-on keep using it for quick trends inside AdvancedMD, and practices without it don't need to buy it first. It also works across any number of office keys.
How often does the data refresh?
On whatever schedule the question needs. Most practice reports refresh overnight, so the morning view holds yesterday complete. Power BI itself allows 8 scheduled refreshes a day on a Pro license and 48 on Premium. A front desk worklist might refresh during the day, while a board report needs nothing more than nightly.
Can Power BI show live AdvancedMD data?
It can come close, but most practice decisions don't need minute-by-minute numbers. What they need is yesterday counted completely and correctly. Where a number does have to move during the day, such as today's check-ins or cards expiring this week, the refresh can run during the day too. Live data that nobody acts on until Friday is wasted effort.
Do I need a data warehouse, or can Power BI read AdvancedMD directly?
Power BI can read some AdvancedMD data directly, and that's fine for a single report. Once you want history, more than one location, or AdvancedMD side by side with payroll and accounting, the data needs a home of its own. We build that on Microsoft SQL or Azure SQL, so every report reads from the same checked copy.
What is Microsoft Fabric, and do I need it?
Fabric is Microsoft's newer analytics service. It brings data storage, data preparation, and Power BI together under one roof. A single practice rarely needs it. It starts to earn its place for multi-location groups with dozens of people logging in, where shared capacity can cost less than a separate license for every viewer.
Can you connect AdvancedMD to our payroll or accounting?
Yes. AdvancedMD provides the hookups for large practices, and payroll, accounting, marketing sources, and patient messaging are the common ones. Connecting them is the easy half. Deciding what to connect and why is the work, because the answer you want usually sits where two of those systems touch, such as staffing cost next to what was collected.
What systems can you connect to AdvancedMD for reporting?
The common ones are payroll, accounting, the clearinghouse, the payment processor, the bank, marketing and referral sources, patient messaging, and labs. Practices on another practice management system can sit side by side with AdvancedMD too. AdvancedMD provides the ODBC and API access that makes this possible, and we keep each connection working.
Can I see all my locations in one report?
Yes, and it's one of the most common reasons groups move to Power BI. The catch is setup. Each location may have been set up differently, by different people, at different times. Roll them together without accounting for that and the total comes out wrong in a way that looks perfectly reasonable. We line the locations up first.
Can I combine AdvancedMD with another practice management system in one view?
Yes. Groups that buy practices running other systems can see them next to their AdvancedMD locations in one report, with the same definition behind every number. That matters most in the months after an acquisition, when each system counts things a little differently and the totals have to be lined up before anyone can compare them.
Can we keep payment and denial history longer than a report shows?
Yes. Because the reports read from your own copy of the data, every payment report and denial reason captured stays there as long as you want it. A question like why a claim was denied last spring can still be answered next year, and every trend can reach back as far as the history goes.
Can you build a report we don't see in your list?
Yes. The catalog on this page is the range, not the limit. If the information exists in AdvancedMD or in a system next to it, we can build the report. Bring the question you keep asking that nobody can answer. If it already lands in Report Center or the add-on, we will point you at that report instead.
What is row-level security?
It's a set of rules inside Power BI that decides which rows of data each person can see, even when everyone opens the same report. A provider sees their own numbers, a location manager sees their location, and an owner sees everything. One report serves the whole practice, and nobody has to maintain separate copies for each role.
Can each provider see only their own numbers?
Yes. With row-level security, a provider opens the same report as everyone else and sees only their own visits, unsigned notes, charges, and collections. That makes a short daily list practical: what's unsigned today, with a dollar figure attached. Providers act on their own list, while a practice-wide total gives them nothing to do.
Can I view the reports on my phone?
Yes. Microsoft makes Power BI apps for iPhone, iPad, and Android, and reports can be laid out for a phone screen. The same security applies, so each person still sees only what they're allowed to see. An owner checking yesterday's deposits and today's open problems from a phone is one of the most common uses.
Can I share reports with my board, lender, or a buyer?
Yes, with controlled access. Each outside viewer gets their own login and sees only the reports and rows you grant them, and access can be removed when the review ends. For a one-time look, a report can also be saved as a PDF. Never use Power BI's publish-to-web option for practice data, because it makes the report public.
Is Power BI HIPAA compliant?
Microsoft lists the Power BI cloud service as covered under its HIPAA business associate agreement, which it offers healthcare customers through its standard online services terms. That covers Microsoft's side. Compliance still depends on how the reports are set up: who can log in, what each person can see, and keeping sharing locked down.
Where does our data live?
Wherever fits your practice: in your own Microsoft environment, or in ours. Either way it sits in a Microsoft database, on Microsoft SQL or Azure SQL, behind the same logins and access rules as the reports. Power BI reads from that copy, and row-level security limits what each person sees, down to the row.
Do patient names show up in the reports?
Patient information is managed under HIPAA rules, so each report shows only the patient detail its reader needs. A front desk worklist of cards expiring this week has to name the patient, and it goes only to the people who make those calls. Owner and board reports work in dollars, counts, and rates, with no names at all.
Who owns the data if we stop working together?
You do. It's your data. It comes from your AdvancedMD system, it belongs to your practice, and it stays yours whether we work together or not. Nothing about how you bill in AdvancedMD changes while we work together, so nothing has to be unwound if you decide to stop.
What reports should a medical practice build in Power BI?
Start from the decision, not the data. List the three questions you ask most, then build the report that settles each one. The three we hear first: days from the visit to cash, denials by cause, and provider productivity. The full range is in the catalog above, and the ten numbers an owner should watch are a good shortlist.
Which numbers should an AdvancedMD practice track every week?
Five. Work that can't bill yet, meaning unsigned notes and visits with no charge. Claims sent against visits delivered. Denials as a short list with a name on every line. Cash expected against cash that arrived. And patient balances by age. Each one changes what somebody does this week, which is the test for a weekly number.
Why does my aging look fine while cash feels tight?
Because days in AR, the measure of how long billed claims take to pay, starts counting when the claim goes out. Anything before that, including notes nobody signed and charges nobody coded, sits outside the number. A practice can hold a healthy aging figure while carrying days of work it hasn't billed yet.
Can Power BI count days from the visit instead of from the claim?
Yes, and it's the first view we build. Power BI can line up the visit date, the charge date, the claim date, and the deposit date for every visit, then show where the days actually go. At one practice, days in AR looked healthy while the real time from visit to usable cash was 76 days. Here's how that happens.
Which date should a report count by?
It depends on the question. Date of service tells you when the work happened. Entry date tells you when someone recorded it. Posting date tells you when a payment was applied, and deposit date tells you when the cash landed. A report that mixes them disagrees with every other report, so Power BI can show the same claims by each date, side by side.
Can Power BI show denials by cause instead of a total?
Yes, and it should. A total tells you how big the pile is. Denials grouped by reason and insurance company tell you where they come from, and a handful of combinations usually carry most of the money. Fix those at the step that created them, such as a missed coverage check at the front desk, and the pile shrinks on its own.
Can Power BI show denial rates by procedure code, insurer, and provider?
Yes. A denial total says how big the pile is. Broken out by procedure code, insurer, and provider together, the same denials show the two or three combinations that drive most of the money, such as one insurer refusing one code from one location. That's the level where a fix at the source becomes obvious.
Can Power BI rank the denial worklist by dollars and track appeals?
Yes. Each open denial can carry its dollar value, its appeal deadline, and its owner, so the team works the most money first instead of the newest item. Appeals get tracked through to the insurer's answer, which shows which kinds are worth filing. Denials nobody has touched since they arrived get flagged before their appeal window closes.
Is my clean claim rate telling me the truth?
Not by itself. The clean claim rate, the share of claims paid the first time they're sent, blends two things: how well your team built each claim, and how insurance companies responded. The industry bar is 95% or higher. Split the misses into the ones your office controlled and the ones it didn't before judging your team.
Can Power BI track provider productivity and wRVUs?
Yes. Encounters, charges, collections, and work relative value units (wRVUs, the standard measure of how much work a visit took) can all be tracked by provider and trended over time. Count them against days actually worked, not calendar days, or a provider on leave looks like a slowdown. The catalog above lists the full set.
Can I measure my billing team's productivity?
Yes, by results rather than activity. Count what each person or function moved to done: charges posted, payments recorded, denials resolved, and dollars recovered. Clicks and notes measure motion, while results measure whether money moved. Trended over time, the view shows who needs help and where a process, not a person, is slowing the whole team down.
Can Power BI find missing charges and unsigned notes?
Yes, by comparing two lists AdvancedMD already keeps: completed appointments and charges created for the same period. Anything seen with no charge is the missing list, and anything documented but unsigned is the list behind it. Neither shows up as a denial or on the aging report, so a side-by-side check is the only reliable way to see them.
Can Power BI show which patients stopped coming?
Yes. It can flag patients who were expected back and have no future appointment booked, by provider and by location. That matters because a slow month usually started months earlier, when those patients drifted off. Broken out by provider, the losses concentrate in a few places, which makes them fixable instead of a practice-wide mystery.
Can Power BI track patient outcomes?
Yes, using the measures your clinicians already record, such as scores at intake and at each follow-up. Power BI can show the share of patients improved since intake by provider, how closely visits follow the care plan, and which chronic care patients are overdue. Comparing providers fairly means accounting for case mix first.
Can Power BI track PHQ-9, GAD-7, and other measurement-based care scores?
Yes. Scores your clinicians already record, such as PHQ-9 for depression, GAD-7 for anxiety, and WSAS for daily functioning, can be tracked visit by visit. The report shows who improved, who got worse, who moved out of the clinical range, and who is overdue for a measure, by provider and by visit frequency.
Can the reports track risk screens and their follow-up?
Yes. Each positive risk screen can be tracked through the same-day safety plan and the follow-up visit, with the time each step took. The report counts screens and follow-ups, and the list of who needs a call goes only to the clinicians responsible, under the same HIPAA rules as the rest of the practice's records.
How do I measure capacity and utilization?
Start with the hours you staff, then count how many were booked, how many were kept, and how many sat open. Utilization is the share of staffed time that turned into kept visits. Capacity is what's left: the visits you could add without hiring, by provider, weekday, and location, for the weeks ahead.
Which referral sources produce revenue, not just visits?
A referral count only shows who sent patients. Joining referral sources to visits, collections, and how long each patient stayed shows what each source is worth a year later. Some sources send fewer patients who stay longer and pay more. Power BI puts that on one page, by source, location, and month, instead of three exports joined by hand.
Can Power BI track conversion from inquiry to first visit?
Yes, by joining your marketing and phone records to AdvancedMD. Each inquiry gets followed through contact, scheduling, the first visit, and the second, by channel. The view shows which channels bring patients who stay, what each new patient costs, and how the time to first contact changes how many people book.
Can Power BI catch underpayments against our contracts?
Yes, once your contracted rates are loaded. Each payment gets compared to what your contract with that insurance company says the procedure code should pay, and the gaps are grouped by insurer and code. A pattern of small underpayments on one common code adds up over a year, and it never shows up on a payment report by itself.
Can Power BI forecast cash for the next 90 days?
Yes, starting from money already owed instead of hoping for next month's visits. Each insurance company's open claims get its own usual time to pay, and patient balances get the rate they really come in. The result is the cash to expect if nothing changes. Your plans go on top of it, so a short month shows up before it arrives.
Should we benchmark our numbers against other practices?
Use outside numbers as a bar, and your own history as the alarm. The industry bar for claims paid on the first try is 95% or higher, and the industry waits 45 to 60 days for cash. A benchmark tells you where you rank. Watching each number against its own recent past tells you the week something changed.
How much does Power BI cost for a medical practice?
Microsoft prices Power BI per person. A Pro license is $14 per user per month, and Premium Per User is $24, which raises the size and refresh limits. Everyone who builds or views shared reports needs one of the two, unless the reports sit on larger Fabric capacity. Check Microsoft's pricing page before budgeting, since prices change.
Do we need someone on staff who knows Power BI?
No. Your team opens the reports, filters them, and acts on what they show, which takes minutes to learn. Building and maintaining the reports, the connections, and the security is our job, and it keeps working when AdvancedMD or Power BI changes. What your team does need is an owner for each list the reports produce.
Do we have to change how we bill?
No. Your team keeps working in AdvancedMD exactly as it does today. The reports read the data and hand back short lists, such as denials to work first or notes waiting on a signature, to the people who own them. What changes is the order the work gets done in, not where it gets done or who does it.
When are AdvancedMD's own reports enough?
When your questions are about one system and one moment: what's aging today, what each provider produced, what the denial rate is. Report Center answers those, included. When your questions are about trends, the paid add-on answers them. You need outside help only when the answer needs two systems side by side, or more history than a report holds.
How do I know if my question needs outside help?
Ask what it would take to produce the answer. Two systems, more history than your reports hold, or a moment nobody wrote down means no report is going to return it. If none of those apply, the answer is probably already in Report Center or the add-on, and we will tell you which one.
What is revenue oversight?
Revenue oversight is the daily job of watching every visit from the booked appointment to money in the bank. Every night it finds where money stopped and where it's about to, then hands a short list, ranked by dollars, to the people who can move it. Reporting tells you what happened. Oversight makes sure somebody acted on it.
How is revenue oversight different from a dashboard?
A dashboard shows numbers and leaves the decision to whoever is reading. Oversight starts from the decision, with the number behind it as evidence. Every line has an owner, a due date, and what done looks like, and nothing counts as done until the money is in the bank. A dashboard nobody acts on is decoration.
Do you just find things, or do you fix them?
Both. Every finding comes with the cause underneath it. Then the fix moves upstream so the problem stops before it forms. It gets held there by a changed step, a rule that runs on its own, or a model where the pattern is too subtle for a person to catch in time.
Do you use AI?
Where the failure only shows up in the shape of the data and a person would spot it too late to matter. Plenty of what we find needs a changed step or a rule that runs nightly instead, and those are cheaper and more durable. We pick the smallest thing that holds, and we're direct about which one it is.
Does this replace revenue cycle management or my billing company?
No. Your billing company or team works claims, denials, and collections day to day, and good ones do it well. We work on why the same denials keep showing up and where the days go before a claim exists. The cause almost always sits earlier than the claim, so the two run alongside each other.
What happens in the first 30 minutes?
No pitch. Bring the one question your reports have never answered. We tell you where it lands, and if it's already in Report Center or the add-on, we point you at the report and we're done. If it needs your data, we show you the first thing it finds, and you decide what's next.
The intelligence comes back the same way every time, not a number that shifts depending on who ran it. We use AI only when and where it makes sense to give your business an advantage it never had before. Built once and watched continuously, a problem shows up the day it starts, not at the quarter-end review when it has already cost you.
See what your AdvancedMD data is actually telling you.
Book 30 minutes. We will connect to your AdvancedMD data, run the intelligence, and show you the first thing it finds.
Grab 30 minutes with us →No pitch. We bring the find. You decide what's next.
Report counts, product names, and other details about AdvancedMD on this page come from AdvancedMD's public website as of October 2026. AdvancedMD updates its products and website from time to time, so current details may differ. Check advancedmd.com for the latest.
AdvancedMD is a trademark of AdvancedMD, Inc. PracticePath is an independent service and is not affiliated with, endorsed by, or sponsored by AdvancedMD, Inc.